1.Which of the following functionalities
joins every record of the dataset with every other record of another dataset?
A) cartesian product
2. Which of the following types of Tableau
data spreads of a single row over multiple coloums?
A) Wide
3. In Tableau, which of the following
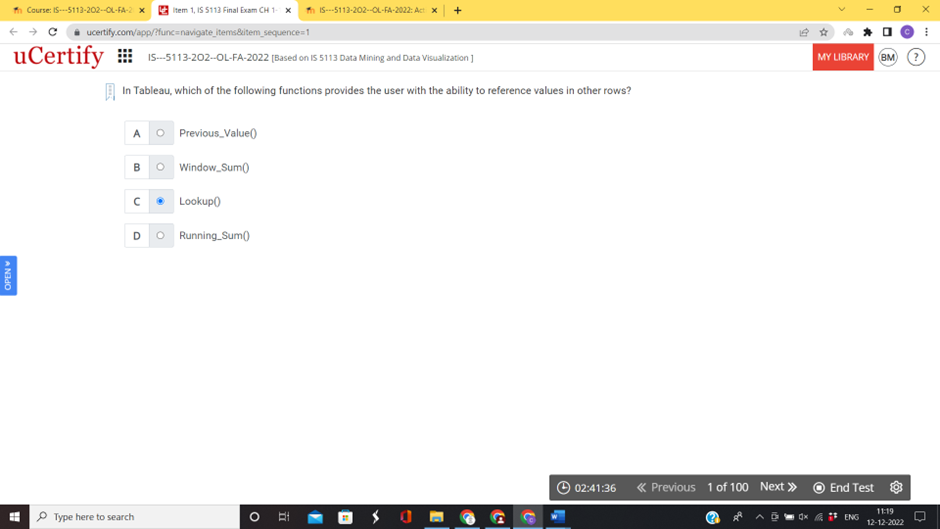
functions provides the use with the ability to reference value in other rows?
A) Lookup()
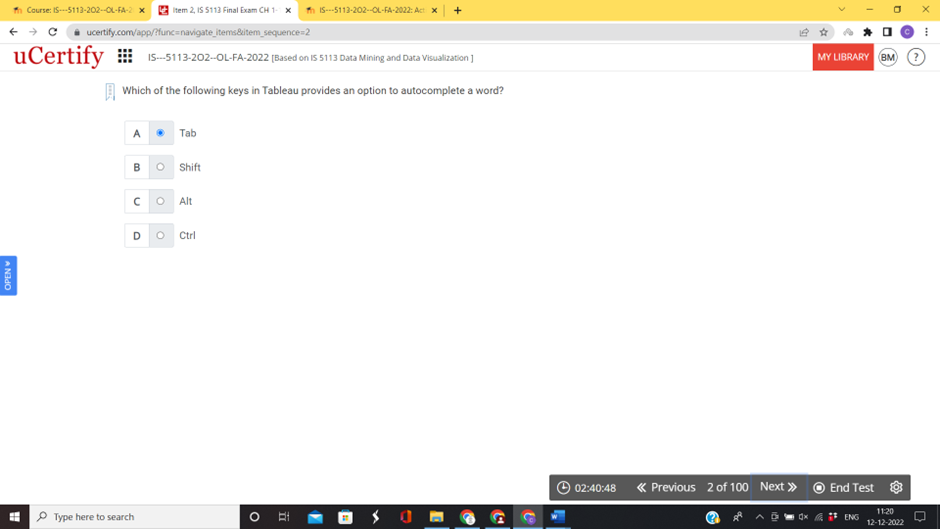
4. Which of the following keys in tableau provides
an option to autocomplete a word?
A) Tab
5. In Tableau, Which of the following tread
models follows an S-shapes curve?
A) Polynomial
6. In Tableau, which of the following
models helps in predicting and visualizing the future values?
A) Forecasting
7. Which of the following types of tableau
data spreads a measure of a single row over multiple columns?
A) Wide
8. Which of the following functionalities
joins ever record of the dataset with every other record of another dataset?
A) Cartesian product
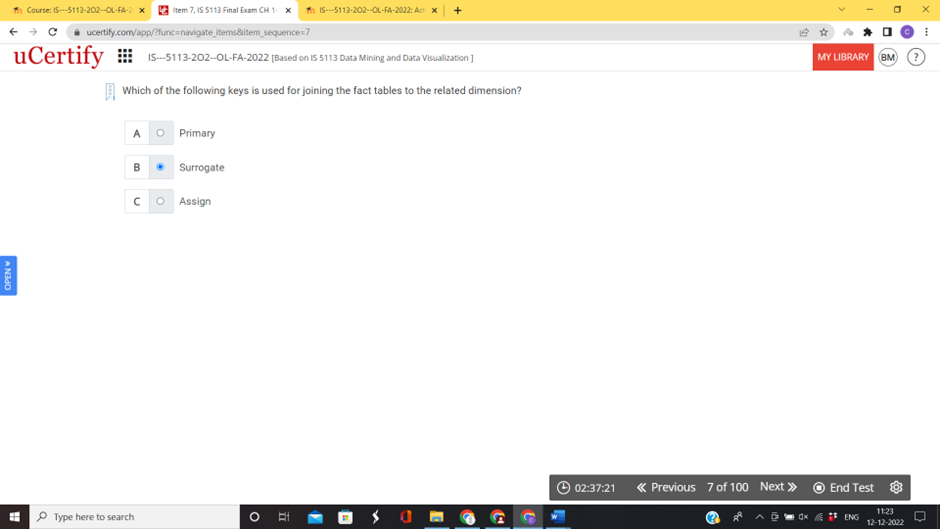
9. Which of the following keys is used for
joining the fact tables to the related dimesion?
A) Surrogate
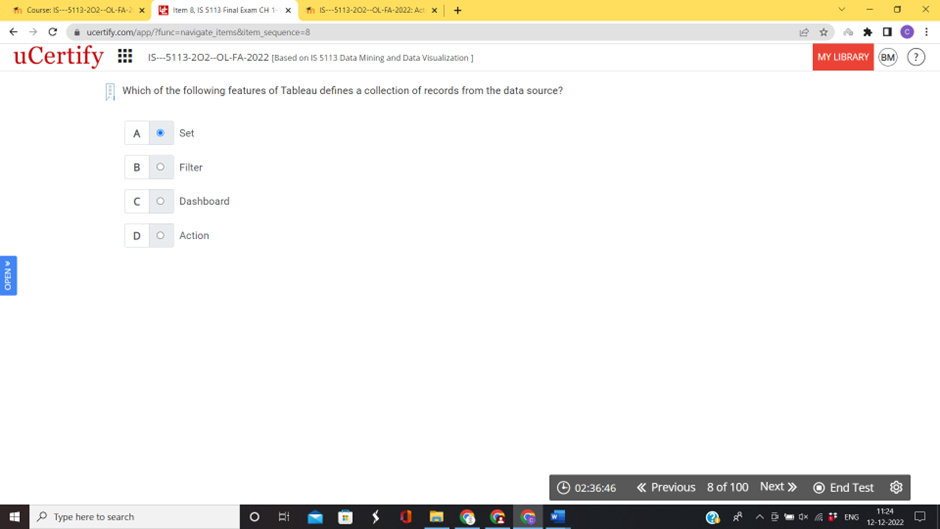
10. Which of the following features of
Tableau defines a collection of record from the data source?
A) Set
11. Which of the following software provides
the user with a platform to view, interpret, and make key decision based on the
data while working within the cycle of analytics?
A) Tableau
12. Which of the following steps of the
analytics cycle provides the user with the ability to create fully interactive
dashboards using visualizations and insights?
A) Data storytelling
13. In Tableau, which of the following
techniques defines the geographic regions created by the users?
A) Custom territory
14.Which of the following components of the
Tableau sheet interface provides the user with the basic functionalities such
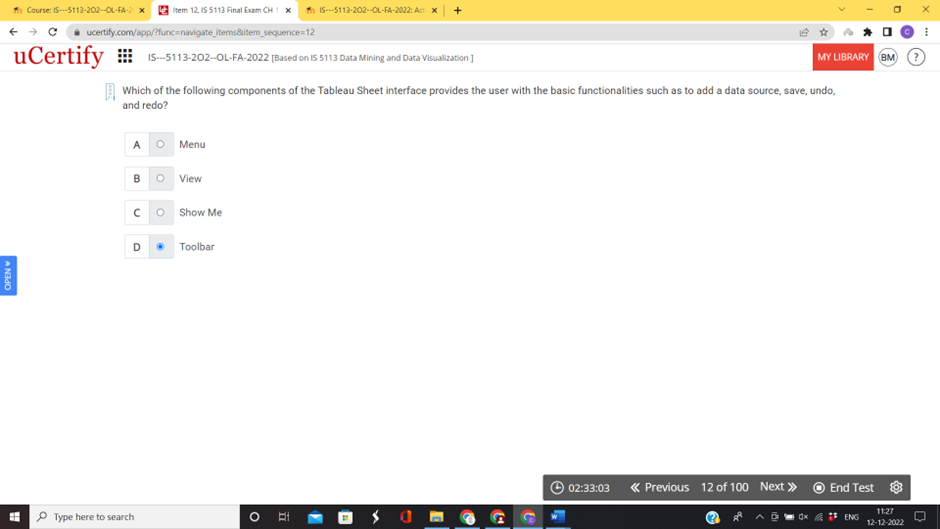
as to add a data source, save, undo, and redo?
A) Toolbar
15. Which of the following data source
connectors provides the user with the ability to remove and join any data
sources using programming languages?
A) Extract API
16. Which of the following features of
Tableau stores information about the connections and all the available fields?
A) Data source
17. Which of the following functionalities
is used to concatenate data tableau?
A) union
18. Which of the following Tableau feature
contains values that determine value that level of at detail at which the
measures are aggregated?
A) Dimensions
19. Which of the following extracts allows
the user to add only the new rows of data based on the specified fields?
A) Incremental refresh
20. Which of the following products allows
the user to interact with the visualizations, dashboards, and created in the
tableau Desktop?
A) Tableau Reader
21. In Tableau, which of the following
fields contains distinct and disparate value?
A) Discrete
22. Which of the following Tableau product
is installed on one of more host machines?
A) Tableau Server
23. Which of the following types uses differing
widths of the bars to communicate additional information about the data?
A) Marimekko
24. Which of the following of tableau is an
arrangement of individual visualization along with of other components on a
single canvas?
A) Dashboard
25. In Tableau, which of the following
steps is responsible for starting the flow with from the file, tables, views,
or custom SQL?
A) Input
26. Which of the following tableau features
is responsible for eliminating the unnecessary joins from the queries?
A) join culling
27. Which of the following types of formats
includes font, alignment, sharing, border, and lines?
A) Sheet
28. Which of the following techniques of
Tableau allows the user to create a smaller subset of records for providing
rapid feedback?
A) Data sampling
29. Which of the following distribution
options of the Tableau server provides the user with the ability to
programmatically export data in different formats?
A) REST API
30. Which of the following tabs of the
filter window allows the user to match the string values?
A) Wildcard
31. Which of the following visualization types
allows the user to compare the values across different categories?
A) Bar chart
32. Which of the following clustering algorithms
is uses by Tableau to group similar data points?
A) K-means
33. Which of the following chart types
shows how the parts are successively built up to whole?
A) Waterfall
34. Which of the following functionalities
mergers the disparate data sources?
A) Cross database join
35. Which of the following of Tableau provide
the user with the ability to drill down to the details?
A) viz in Tooltip
36. Which of the following types of
calculator allows the user to perform aggregations that results in the value at
a row-level?
A) Level of detail
37. Which of the following file extension specifies
a Tableau data source extracted file?
A) .tdsx
38. Which of the following set types is a
list of value for one or more dimensions?
39. Which of the following techniques of
data visualization for adding a bit of intentional to a visualization?
A) Jittering

40. Which of the following features of
Tableau helps in revealing the patterns occurring over time for bringing life to
data storytelling?
41. Which of the following visualization types
is used for understanding the of events with a duration?
A) Gantt chart
42. Which of the following annotations is
associated with a specific symbol in the view?
A) Mark
43. In Tableau, Which of the following
keyboard shortcuts is used to exit the presentation mode?
A) F7
44. Which of the following levels of formatting
allows the user to make global changes?
A) Workbook
45. Which of the following line charts is
the most commonly used and displays the motion of the value over time?
A) Time series
46. Which of the following Tableau objects defines
simple as well as complex geographic areas?
A) Spatial
47. Which of the following features of
Tableau defines a series of logical steps and changes that can be applied to
the data from input to output?
A) Data flow
48. Which
of the following keys creates a copy of the field while moving it from one
shelf to another?
A) Ctrl
49. Which of the following features of
tableau allows the user to construct sets of various dimensional values that
can be used as a primary source?
A) Data scaffolding
50. Which of the following features of
Tableau enables the user to find groups or individual data points based on
various selections made by the user?
A) Clustering
51. Which of the following components of
the Tableau dashboard window allows the objects on the dashboard?
A) Grip
52. Which of the following functions in
Tableau is used to break a string into multiple value?
A) SPLIT()
53. Which of the following functions groups
in Tableau of the decision-making function?
A) Logical
54. Which of the following features in
Tableau is used to store a single or a global value?
A) Parameter
55. Which of the following tabs in Tableau
is used to box and whisker plots?
A) Analytics
56. Which of the following calculations in
Tableau can be applied to the fields that are used as a measure in the view?
A) Quick Table Calculations
57. Which of the following features of the
Tableau server allows the user to schedule periodic emails of a screenshot the
dashboard?
A) Subscribe
58. Which of the following Table calculation
functions begins with the value of 1 and keeps increasing by one moving along a
given direction within a given scope?
A) Index()
59. Which of the following object types is
the default for all the objects added to the dashboard?
A) Tiled
60. Which of the following background user
a reversed sequential color palette?
A) Black
61. Which of the following features of
tableau allows the user to impart a data story while working with different
views, filters , parameters, and images collectively?
A) Dashboard
62. In tableau, which of the following
steps allows the user to join two branches o the flow based on one or more key
fields?
A) Join
63. Which of the following features of
tableau is referred to as view and is single data visualization?
A) Sheet
64. Which of the following sections in
tableau is by default used for placing the calculations with a numeric result?
A) Measures
65. Which of the following features of
tableau is initiated by the user and triggers response?
A) Action
66. Which of the following tableau add-ons
provides the user with the ability to monitor and troubleshoot and present a
visual experience for cleaning and shaping data?
A) Tableau prep
67. Which of the following file extensions represents
a spatial file in tableau?
A) .Kml
68. in Tableau, which of the following
statistical measures defines the probability of obtaining the same trend without
taking the dimensions into account?
A) P-value
69. Which of the following windows keyboard
shortcuts in tableau neglects the cache and refreshes the data from its source?
A) F5
70. Which of the following terms in Tableau
defines the boundaries within a table Calculation can reference other value?
A) Scope
71. Which of the following palettes assigns
a starting as an ending number that provides a full intensity that provides a
full intensity for both the color ranges?
A) Diverging
72. In Tableau, which of the following file
extensions used to save a package workbook?
A) .twbx
73. Which of the following fields on the Tableau
shelf in the view uses a Table Calculation?
74. Which of the following data types forms
up the data hierarchy?
A) Date part
75. In Tableau, Which of the following
techniques is used to dynamically show or hide the views on a dashboard?
A) Sheet swapping
76. Which of the following types of level
of details calculations is used to omit the defined dimensions from the view?
A) Exclude
77. Which of the following types of bar
charts is used for comparing a measure a goal?
A) Bullet graph
78. How many entries are allowed by a
format string in Tableau?
79. The multiple mark types are located beside
other on which two shelves in Tableau?
80. In Tableau, Which of the following
modes helps the users in building flows, adding steps, making changes, and interacting
with the data?
81. Which of the following actions focuses
on specific marks and headers in one or more views?
82. Which of the following calculations is
slower than the Boolean numeric calculations?
A) String
83. Which of the following features of
Tableau helps the user to quickly the confidence intervals, percentages,
percentiles, quantiles, and standard deviations of the dataset?
A) Distributions
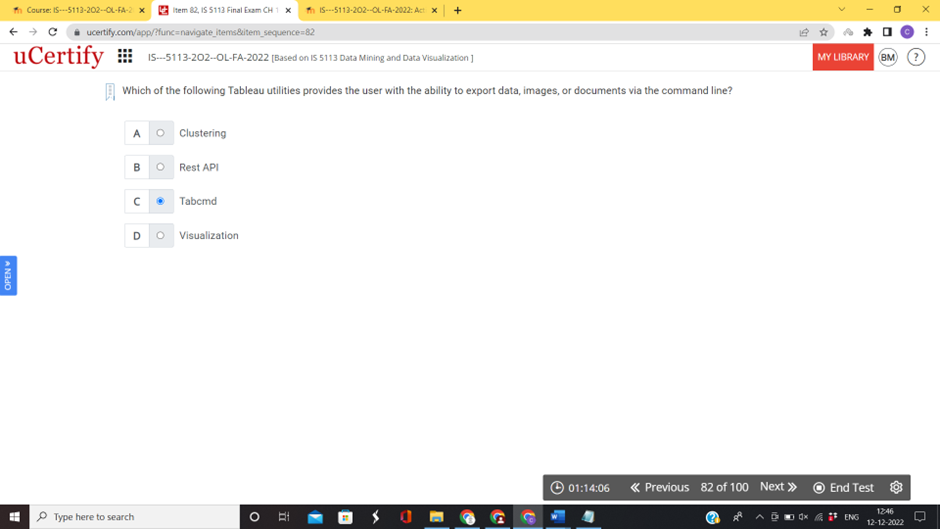
84. Which of the following Tableau utilities
provides the user with the ability to export data, images, or documents via the
command line?
A) Tabcmd
85. Which of the following direction options
when used on tables increments index over the entire table?
A) table (across)
86. Which of the following approaches to building
a dashboard indicates the good versus the poor performance?
A) key performance indicators
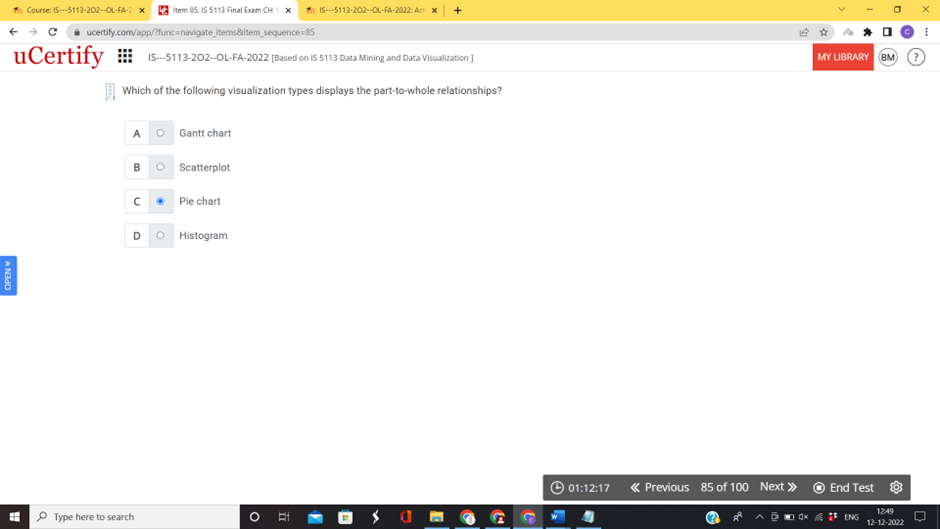
87. Which of the following visualization types
displays the part-to-whole relationships?
A) Pie chart
88. In Tableau, which of the following
functions operates across all the rows in the partition at once and performs
the aggregation of the first levels row in the Tableau sheet?
A) window_sum()
89. Which of the following keys should the
hold down while dragging an object to convert it from tiled to floating or vice
versa?
A) shift
90. Which of the following query languages
provides a standard way of defining queries related to the data based on the arrangement
of different fields in the view?
A) Visual Query Language
91. In Tableau, Which of the following
steps steps defines the ultimate destination for the cleaned and transformed
data?
A) output
92. Which of the following trend models
displays a steady increase or the value of the variables over the period of time?
A) Linear
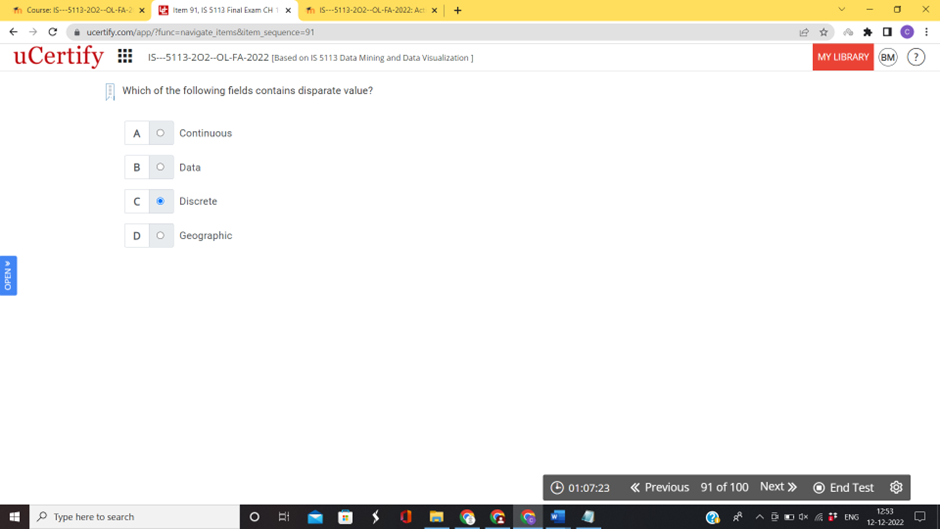
93. Which of the following fields contains
disparate value?
A) Discrete
94. Which of the following charts user multiple
mark types in the same visualization?
A) Combination chart
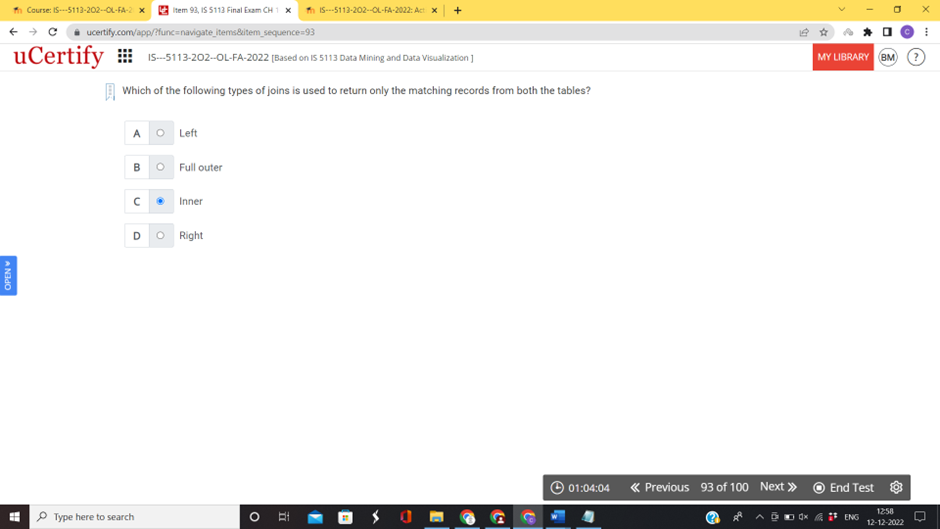
95. Which of the following types of joins
is used to return only the matching records form both the tables?
A) Inner
96. Which of the following features of
Tableau consists of a code that is made up of different functions, operations,
and reference to the other fields?
A) Calculation
97. Which of the following calculations in
Tableau, allows the user to add the calculated fields to the shelves in a
single view?
A) Ad hoc
98.Which of
the following visualization types is used for displaying the hierarchical
relationships?
A) Treemap
99. Which of the following Tableau terms
incident that the missing values or records are filed-in?
A) Data densification
100. In tableau, which of the following functions allows integration with the R analytics
platform or Python?
A) Script
101. In Tableau, which of the following
visualization types uses multiple small strokes designed for rapid reading and
comparison?
A) Spark Lines
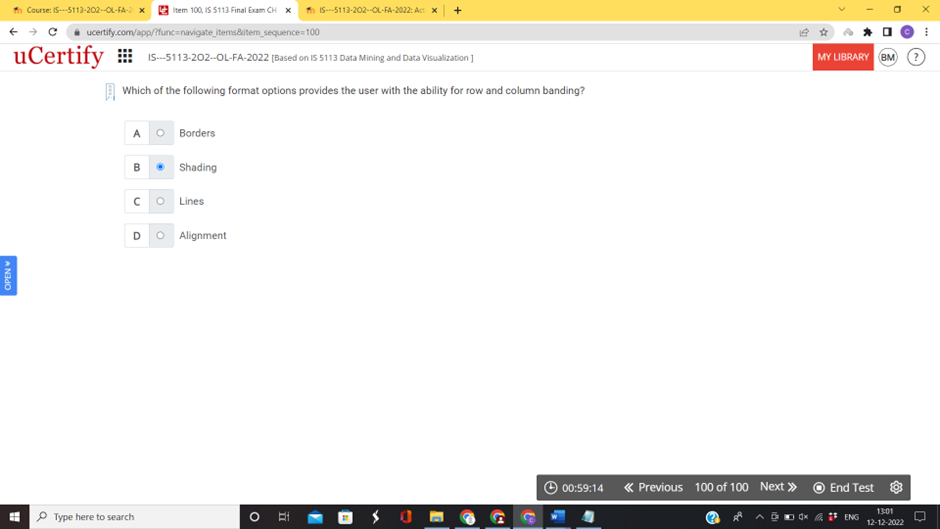
102. Which of the following format options
provides the user with the ability for row and column banding?
A) Shading
RESULT
Which of the following features of Tableau is an arrangement of individual visualizations along with the other components on a single canvas?
Dashboard
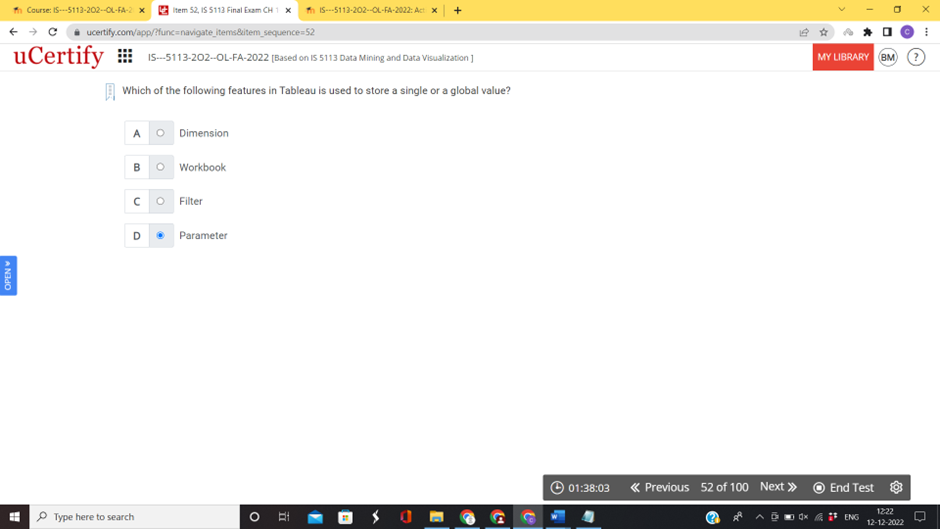
Which of the following features in Tableau is used to store a single or a global value?
Parameter
Which of the following query languages provides a standard way of defining queries related to the data based on the arrangement of different fields in the view?
Visual Query Language
In Tableau, which of the following keyboard shortcuts is used to exit the presentation mode?
F7and
Which of the following features of Tableau allows the user to narrate a tale using the interactive snapshots of dashboards and views?
Story
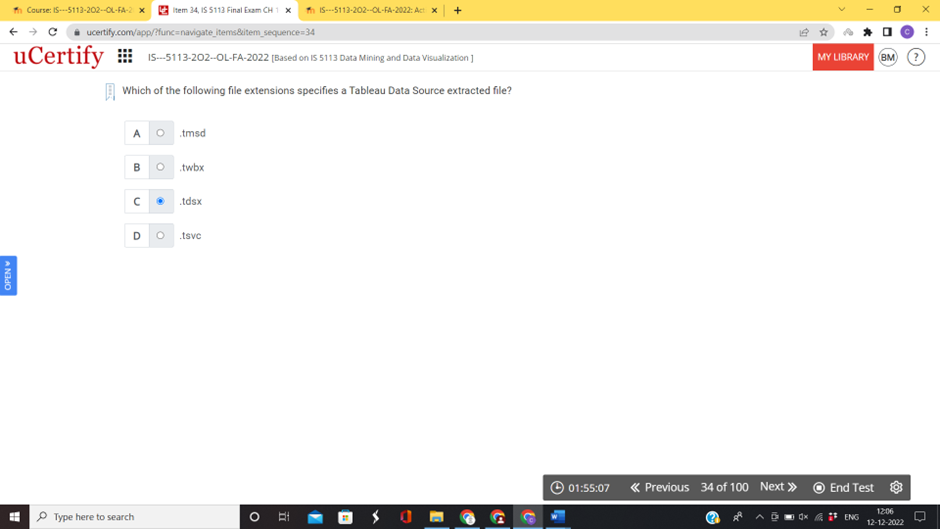
Which of the following file extensions specifies a Tableau Data Source extracted file?
.tdsx
Which of the following Tableau add-ons provides the user with the ability to monitor and troubleshoot and present a visual experience for cleaning and shaping data?
Tableau Prep
Which of the following line charts is the most commonly used and displays the motion of the values over time?
Time series
Which of the following visualization types allows the user to compare the values across different categories?
Bar chart
Which of the following object types is the default for all the objects added to the dashboard?
Tiled
Which of the following fields contains disparate value?
Discrete
Which of the following direction options when used on tables increments Index over the entire table?
Table (across)
Which of the following terms in Tableau defines the boundaries within which a Table Calculation can reference other values?
Scope
In Tableau, which of the following steps is responsible for starting the flow with data from the files, tables, views, or custom SQL?
Input
Which of the following tabs in Tableau is used to add box and whisker plots?
Analytics
In Tableau, which of the following modes helps the users in building flows, adding steps, making changes, and interacting with the data?
Design
Which of the following calculations in Tableau can be applied to the fields that are used as a measure in the view?
Quick Table Calculations
Which of the following features of Tableau provides the user with the ability to drill down to the details?
Viz in Tooltip
In Tableau, which of the following fields contains distinct and disparate values?
Discrete
Which of the following keys should the user hold down while dragging an object to convert it from tiled to floating or vice versa?
Shift
Which of the following Tableau products is installed on one or more host machines?
Tableau Server
Which of the following visualization types is used for understanding the sequence of events with a duration?
Gantt chart
Which of the following Table Calculation functions begins with the value of 1 and keeps increasing by one moving along a given direction within a given scope?
Index()
Which of the following features of Tableau enables the user to find groups or individual data points based on various selections made by the user?
Clustering
Which of the following data source connectors provides the user with the ability to remove and join any data sources using programming languages?
Extract API
In Tableau, which of the following visualization types uses multiple small strokes designed for rapid reading and comparison?
Spark Lines
Which of the following components of the Tableau Sheet interface provides the user with the basic functionalities such as to add a data source, save, undo, and redo?
Toolbar
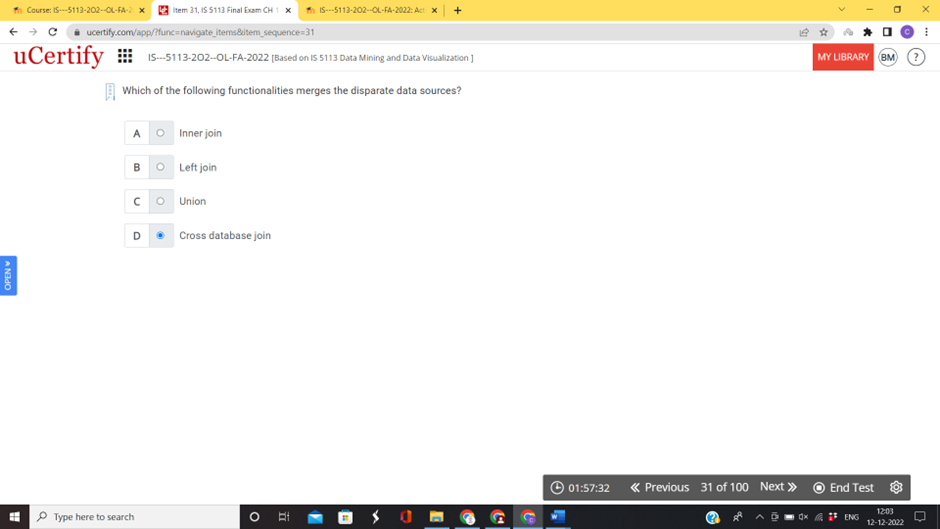
Which of the following functionalities merges the disparate data sources?
Cross database join
Which of the following types of level of detail calculations is used to omit the defined dimensions from the view?
Exclude
Which of the following features of Tableau allows the user to construct sets of various dimensional values that can be used as a primary source?
Data scaffolding
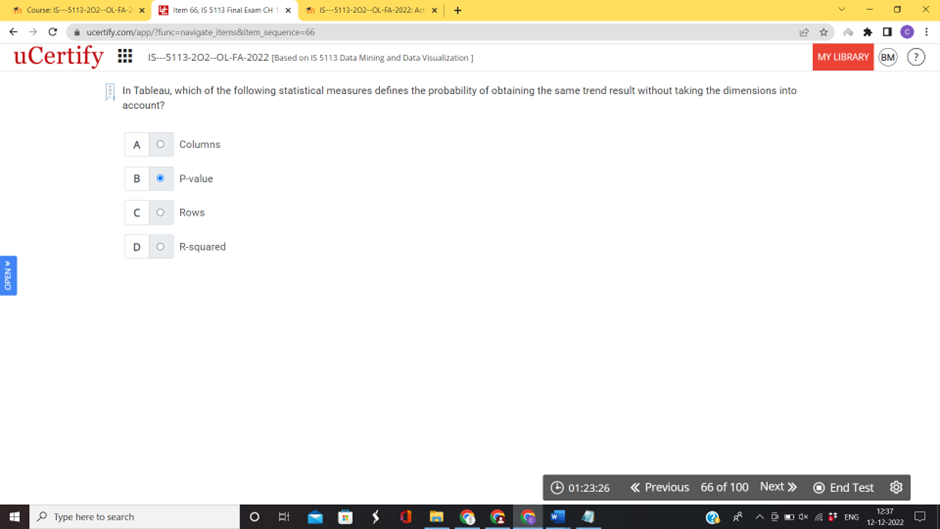
In Tableau, which of the following statistical measures defines the probability of obtaining the same trend result without taking the dimensions into account?
P-value
In Tableau, which of the following chart types displays a change of value from one period to another?
Slope
Which of the following features of Tableau allows the user to impart a data story while working with different views, filters, parameters, and images collectively?
Dashboard
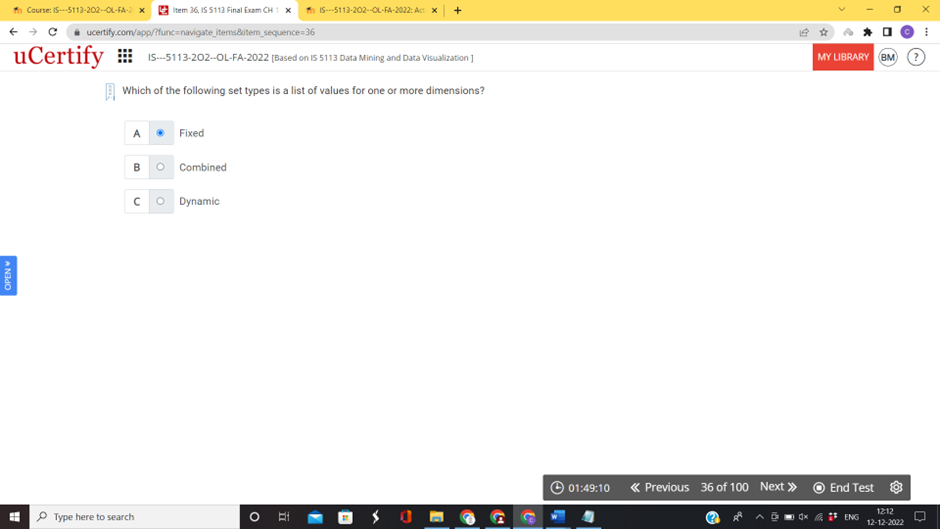
Which of the following set types is a list of values for one or more dimensions?
Fixed
Which of the following types of joins is used to return only the matching records from both the tables?
Inner
Which of the following features of the Tableau Server allows the user to schedule periodic emails of a screenshot of the dashboard?
Subscribe
Which of the following clustering algorithms is used by Tableau to group similar data points?
K-means
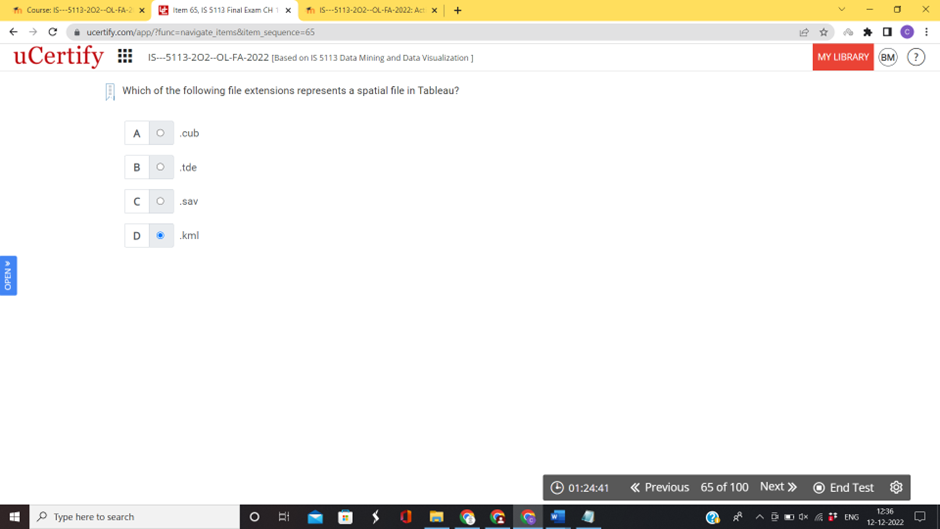
Which of the following file extensions represents a spatial file in Tableau?
.kml
In Tableau, which of the following techniques defines the geographic regions created by the users?
Custom territory
Which of the following Windows keyboard shortcuts in Tableau neglects the cache and refreshes the data from its source?
F5
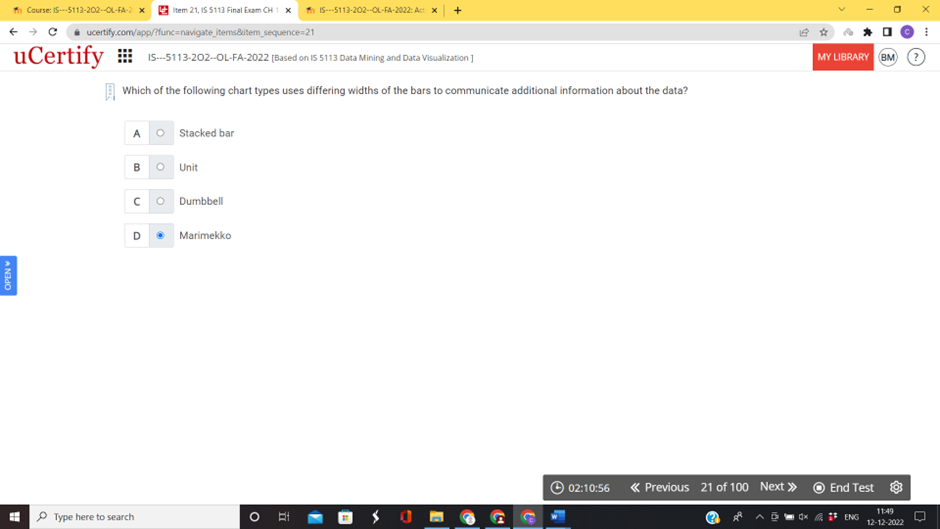
Which of the following chart types uses differing widths of the bars to communicate additional information about the data?
Marimekko
Which of the following techniques of Tableau allows the user to create a smaller subset of records for providing rapid feedback?
Data sampling
Which of the following sections in Tableau is by default used for placing the calculations with a numeric result?
Measures
Which of the following Tableau features is responsible for eliminating the unnecessary joins from the queries?
Join culling
Which of the following techniques of data visualization is used for adding a bit of intentional noise to a visualization?
Jittering
Which of the following features of Tableau is referred to as view and is single data visualization?
Sheet
Which of the following format options provides the user with the ability for row and column banding?
Shading
Which of the following keys is used for joining the fact tables to the related dimension?
Surrogate
Which of the following software provides the user with a platform to view, interpret, and make key decisions based on the data while working within the cycle of analytics?
Tableauand
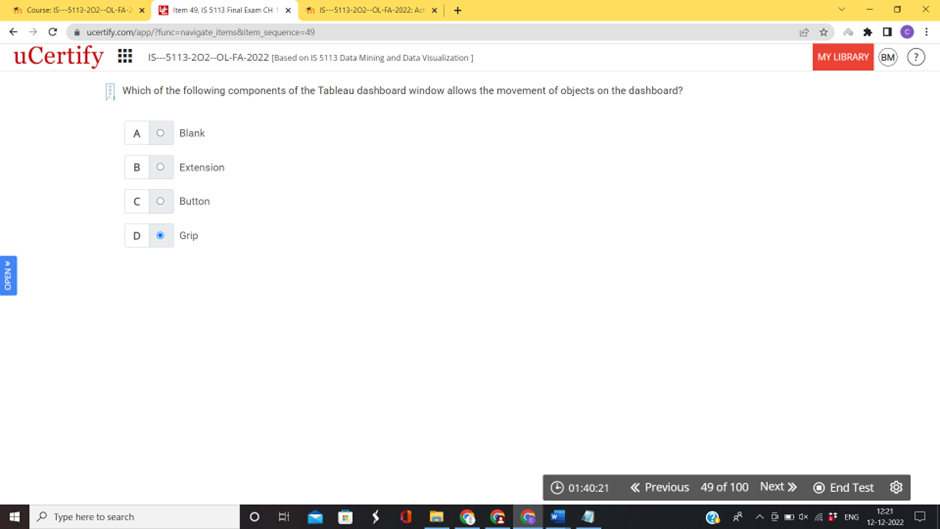
Which of the following components of the Tableau dashboard window allows the movement of objects on the dashboard?
Grip
Which of the following types of bar charts is used for comparing a measure with a goal?
Bullet graph
Which of the following types of Tableau data spreads a measure of a single row over multiple columns?
Wide
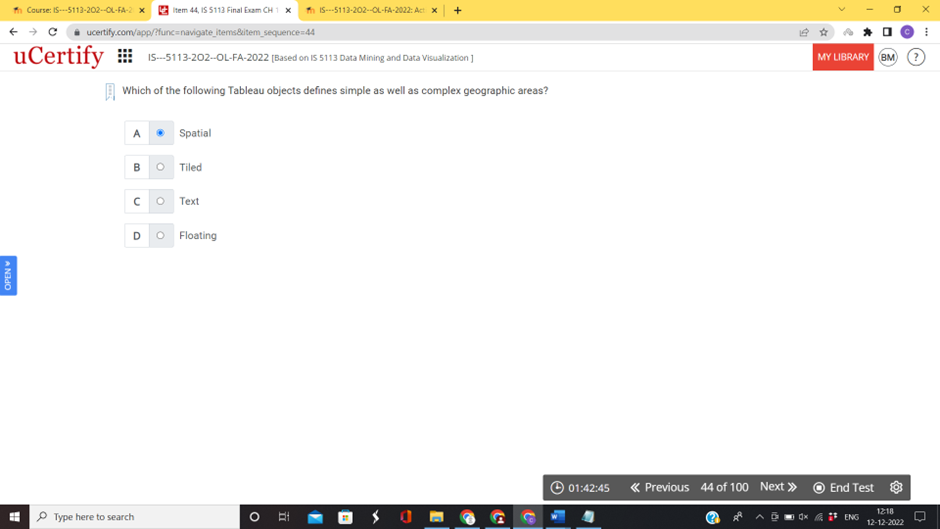
Which of the following Tableau objects defines simple as well as complex geographic areas?
Spatialand
Which of the following features of Tableau stores information about the connections and all the available fields?
Data source
Which of the following functions groups in Tableau consists of the decision-making function?
Logical
Which of the following annotations is associated with a specific symbol in the view?
Markand
Which of the following date types forms up the date hierarchy?
Date part
Which of the following palettes assigns a starting as well as an ending number that provides a full intensity for both the color ranges?
Diverging
Which of the following types of calculation allows the user to perform aggregations that result in the value at a row-level?
Level of detail
In Tableau, which of the following functions operates across all the rows in the partition at once and performs the aggregation of the first level row in the Tableau sheet?
Window_Sum()
Which of the following functionalities is used to concatenate the data tables?
Unionand
In Tableau, which of the following functions allows integration with the R analytics platform or Python?
Scriptand
Which of the following approaches to building a dashboard indicates the good versus the poor performance?
Key Performance Indicators
Which of the following features of Tableau is initiated by the user and triggers a response?
Actionand
In Tableau, which of the following features defines the arrangement of the visualizations on a single canvas?
Dashboard
Which of the following visualization types displays the part-to-whole relationships?
Pie chart
In Tableau, which of the following steps allows the user to join two branches of the flow based on one or more key fields?
Joinand
Which of the following trend models displays a steady increase or decrease in the value of the variables over the period of time?
Linear
Which of the following Tableau terms indicates that the missing values or records are filled-in?
Data densification
Which of the following features of Tableau helps the user to quickly visualize the confidence intervals, percentages, percentiles, quantiles, and standard deviations of the dataset?
Distributions
In Tableau, which of the following steps defines the ultimate destination for the cleaned and transformed data?
Outputand
In Tableau, which of the following trend models follows an S-shaped curve?
Polynomialand
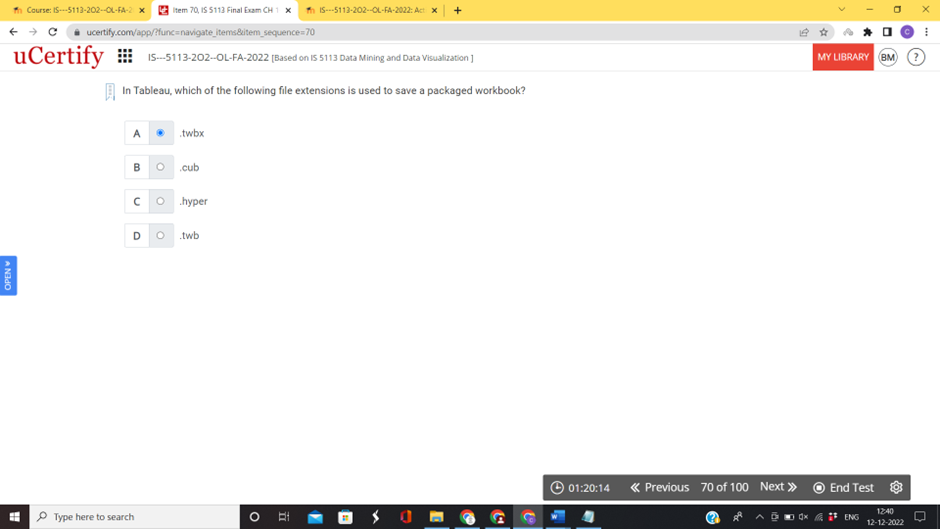
In Tableau, which of the following file extensions is used to save a packaged workbook?
.twbx
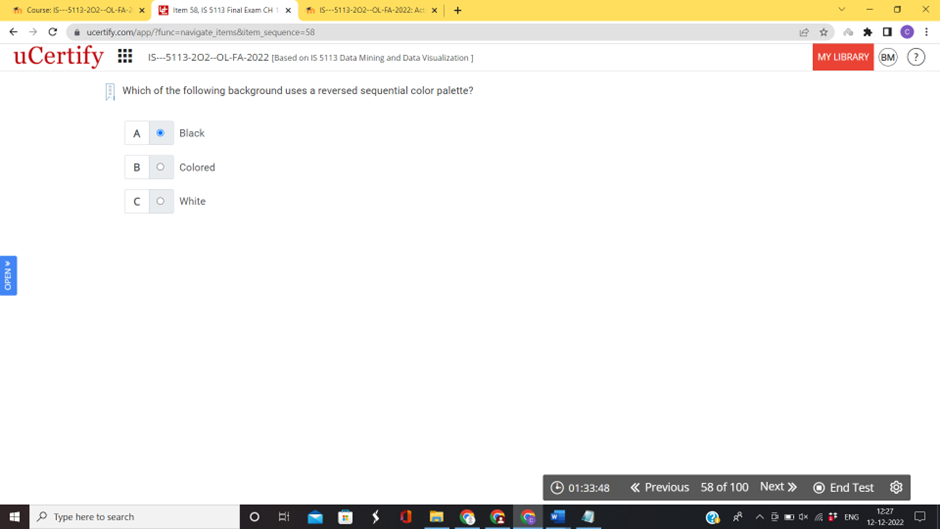
Which of the following background uses a reversed sequential color palette?
Black
Which of the following products allows the user to interact with the visualizations, dashboards, and stories created in the Tableau Desktop?
Tableau Reader
Which of the following extracts allows the user to add only the new rows of data based on the specified fields?
Incremental refresh
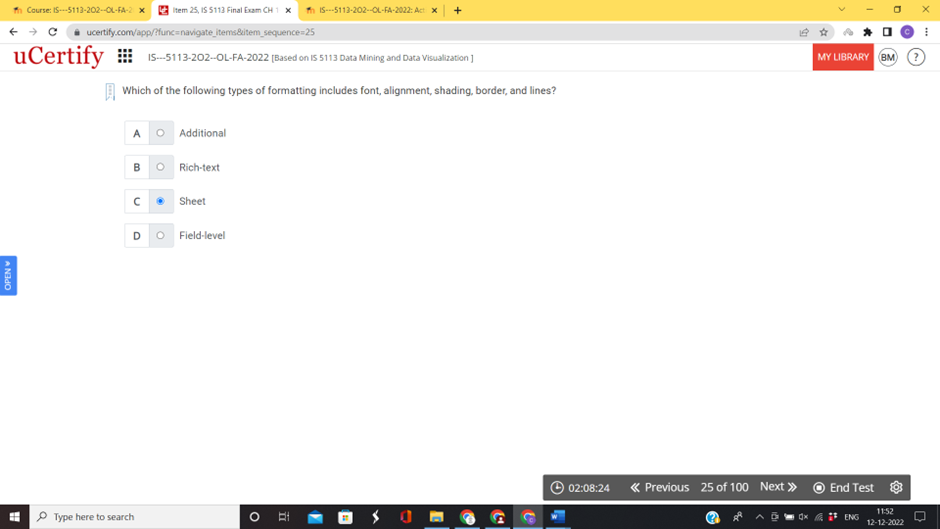
Which of the following types of formatting includes font, alignment, shading, border, and lines?
Sheetand
Which of the following features of Tableau defines a series of logical steps and changes that can be applied to the data from input to output?
Data flow
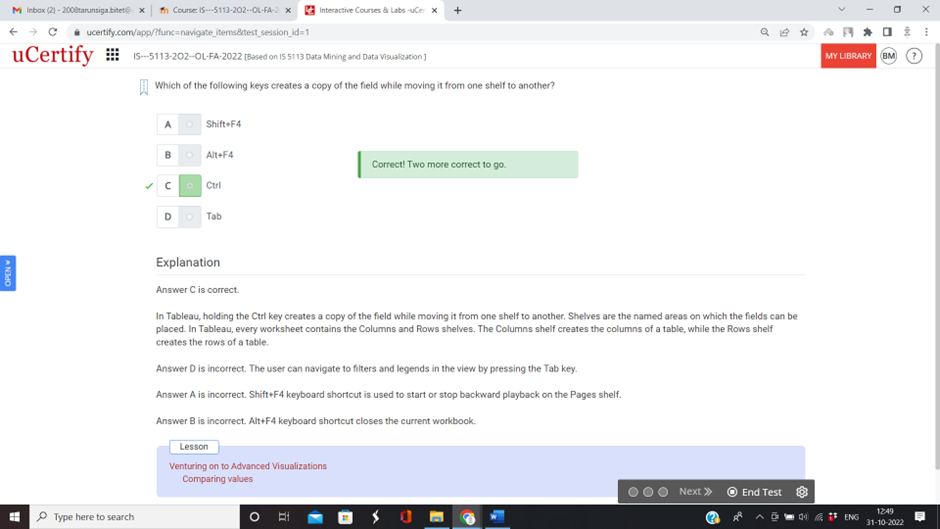
Which of the following keys creates a copy of the field while moving it from one shelf to another?
Ctrl
Which of the following charts uses multiple mark types in the same visualization?
Combination chart
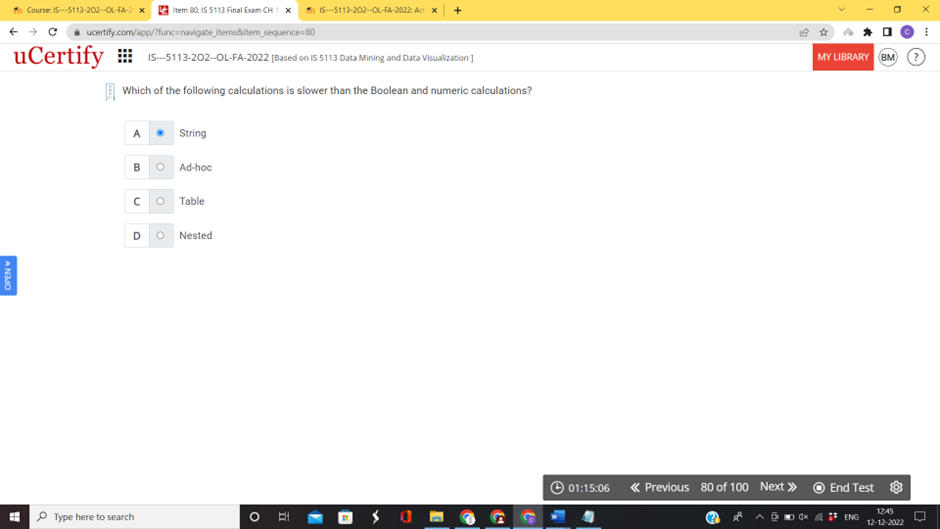
Which of the following calculations is slower than the Boolean and numeric calculations?
Stringand
Which of the following calculations in Tableau allows the user to add the calculated fields to the shelves in a single view?
Ad hoc
Which of the following fields on the Tableau shelf in the view uses a Table Calculation?
Deltaand
Which of the following chart types shows how the parts are successively built up to a whole?
Waterfalland
Which of the following keys in Tableau provides an option to autocomplete a word?
Tab
Which of the following tabs of the Filter window allows the user to match the string values?
Wildcardand
The multiple mark types are located beside each other on which two shelves in Tableau?
Rows, Columns
Which of the following functions in Tableau is used to break a string into multiple values?
SPLIT()
Which of the following visualization types is used for displaying the hierarchical relationships?
Treemapand
Which of the following levels of formatting allows the user to make global changes?
Workbookand
Which of the following Tableau utilities provides the user with the ability to export data, images, or documents via the command line?
Tabcmd
Which of the following calculations is performed after the initial query in Tableau?
Table
In Tableau, which of the following models helps in predicting and visualizing the future values?
Forecasting
How many entries are allowed by a format string in Tableau?
Threeand
Which of the following distribution options of the Tableau Server provides the user with the ability to programmatically export data in different formats?
REST API
Which of the following features of Tableau helps in revealing the patterns occurring over time for bringing life to data storytelling?
Animated visualization
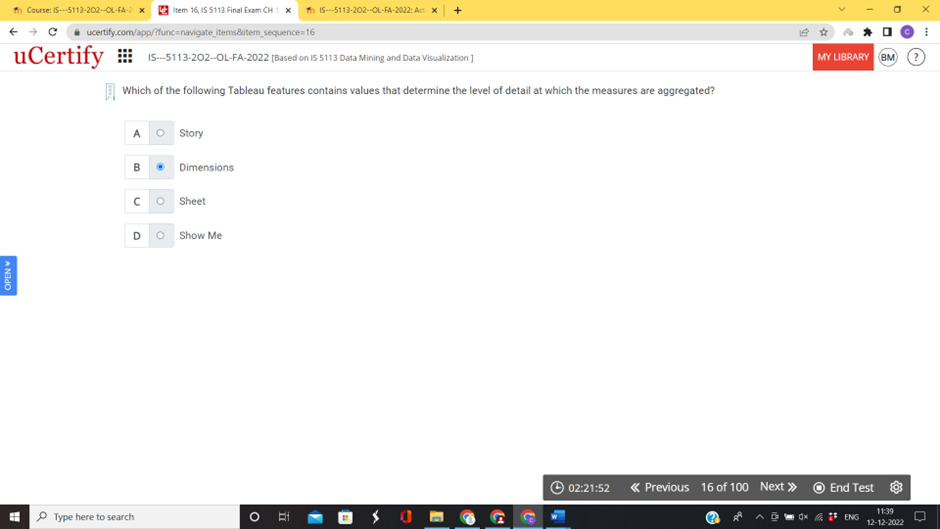
Which of the following Tableau features contains values that determine the level of detail at which the measures are aggregated?
Dimensionsand
Which of the following steps of the analytics cycle provides the user with the ability to create fully interactive dashboards using visualizations and insights?
Data storytelling
Which of the following functionalities joins every record of the dataset with every other record of another dataset?
Cartesian product
Which of the following features of Tableau consists of a code that is made up of different functions, operations, and references to the other fields?
Calculationand
1. Which of
the following keys creates a copy of the field while moving it from one shelf
to another?
A. Ctrl
2. Which of
the following features of Tableau provides the user with the ability to drill
down to the details?
A. Viz
in Tooltip
3. The
______ functions allow integration with the R analytics platform or Python.
A. Script
4. The ________ visualization type
is used for displaying the hierarchical relationships.
A. treemap
5. Which of the following functions begins
with the value of 1 and keeps increasing by one moving along a given direction
within a given scope?
A. Index()
6. What is a dimension?
A. A value that determines the level of detail at which
the measures are aggregated
7. What is
the function of an incremental refresh
A. It
allows a user to add only new rows of data based on the specific fields.
8. The
_______ key is used for joining the fact tables to the related dimension.
A. surrogate
9. The
keyboard shortcut in Tableau that neglects the cache and refreshes the data
from its source is:
A. F5
10. In Tableau, which of
the following fields contains distinct and disparate values?
A. Discrete
11.By
default, all the objects added to the dashboard are:
A. tiled
12. Which
of the following calculations allows a user to add the calculated fields to the
shelves in a single view without adding fields to the data pane?
A. Ad hoc
13. Which of the following defines the
boundaries within which a table calculation can reference other values?
A. Scope
14. Which of the following date fields represents
a specific measure of the date, such as the quarter or month?
A. Date part
15. Which of the following is referred to as a
view and is single data visualization?
A. Sheet
16. Which of the following consists of a code
made up of different functions, operations, and references to the other fields?
A. Calculation
17. Which
type of data spreads a measure of a single row over multiple columns?
A. Wide
18. Which
type of chart uses differing widths of the bars to communicate additional
information about the data?
A. Marimekko
19. The
clustering algorithm used by Tableau to group similar data points is:
A. k-means
20.Which of
the following statements is true regarding clustering?
A. It
enables a user to find groups or individual data points based on various
selections made by him.
21.Which of
the following types of joins is used to return only the matching records from
both the left and right tables?
A. Inner
22. A ____
set is a list of values for one or more dimensions. If the values for a single record
are present in the list defined by the set, then the record is in the set else
out.
A. fixed
23. Which
of the following calculations is slower than the boolean and numeric
calculations?
A. String
In Tableau,
which of the following file extensions is used to save a packaged workbook?
A. .twbx
The ______ mode helps users in building
flows, adding steps, making changes, and interacting with the data.
A. design
The _______
function is used to break a string into multiple values.
A. SPLIT()
Which of
the following components is used to undo, redo, save, and add a data source?
A. Toolbar
What is a linear trend model?
A. A trend model that displays a steady increase or
decrease in the value of the variables over a period of time
The Tableau feature responsible
for eliminating the unnecessary joins from
the queries is:
A. join culling
The visualization type that uses
multiple small strokes designed for rapid reading and comparison is:
A. sparklines
Which of the following
functions operates across all the rows in the partition at
once and performs the aggregation of the first level row in the Tableau sheet?
A. Window_Sum()
The Subscribe feature of the toolbar allows
a user to:
A. schedule periodic emails of a screenshot of the
dashboard
Which of the following chart types shows
how the parts are successively built up as a whole?
A. Waterfall
A type of line chart that displays the motion of
the values over time is a:
A. time series
Which statistical measure defines the probability
of obtaining the same trend result without taking the dimensions into
account?
A. P-value
A _________ file extension represents a spatial
file in Tableau.
A. .kml
The background that uses a
reversed sequential color palette is:
A. black
Which of the following fields contains disparate value?
A. Discrete
What does the Shading format option include?
A. Row and column banding
What is a level of detail calculation?
A. A calculation that allows a user to perform
aggregations that result in the value at a row level
What is the technique of data visualization
that involves adding a bit of intentional noise to a visualization to
avoid overlap without harming the integrity of what is being communicated
called?
A. Jittering
What is Tableau Reader?
A. A free application provided by Tableau Software
that allows a user to interact with the visualizations, dashboards, and stories
created in Tableau Desktop
Which of the following
Tableau products is installed on one or more host machines?
A. Tableau Server
Which of the following statements
is true regarding a dashboard?
A. It allows a user to impart a data story while
working with different views, filters, parameters, and images collectively.
Which of the following keys in Tableau provides an
option to autocomplete a word?
A. Tab
The Tableau add-on that provides a user with the
ability to monitor and troubleshoot and present a visual experience
for cleaning and shaping data is:
A. Tableau Prep
Which of the following types of level of detail
calculations is used to omit the defined dimensions from the view?
A. Exclude
Which of the following steps of the
analytics cycle provides a user with the ability to create fully
interactive dashboards using visualizations and insights?
A. Data storytelling
Which of the following charts uses multiple mark
types in the same visualization?
A. Combination chart
Which of the following techniques allows a user to
create a smaller subset of records for providing rapid feedback?
A. Data sampling
Which of the following statements is true
regarding the mark annotation?
A. It is linked to a specific mark and will not be
visible if the mark is filtered out or falls outside the axis range.
A field on a shelf in the view that is using
a table calculation, or which is a calculated field using table
calculation functions, will have a ______ symbol icon.
A. delta
Which of the following features allows a user to
narrate a tale using the interactive snapshots of dashboards and
views?
A. Story
Which of the following tabs in Tableau is
used to add box and whisker plots?
A. Analytics
Which of the following calculations is performed
after the initial query in Tableau?
A. Table
Which of the following provides a user with
the ability to programmatically export data in different formats?
A. REST API
______ objects define geographic areas that are as
simple as a point and as complex as multi-sided polygons.
A. Spatial
Which of the following software provides
a user with a platform to view, interpret, and make key decisions
based on the data while working within the cycle of analytics?
A. Tableau
The functionality used to concatenate the data
tables that bring together the rows of each table into a single data
source is:
A. union
Which of the following features of Tableau is
an arrangement of individual visualizations along with the other
components on a single canvas?
A. Dashboardand
What is the process that allows a user to construct
sets of various dimensional values that can be used as a primary
source called?
A. Data scaffolding
Which tab of the Filter window allows a user to match the
string values that contain start with, end with, or exactly match a
given value?
A. Wildcard
A _______ step allows a user to connect two
branches of the flow based on one or more key fields.
A. join
Which of the following steps is responsible for starting the
flow with data from the files, tables, views, or custom SQL?
A. Input
Why is a pie chart used in Tableau?
A. To display the part-to-whole relationships
Which function group consists of the
decision-making functions?
A. Logical
What is VizQL?
A. A query language that provides a standard way of
defining queries related to the data based on the arrangement of different
fields in the view
What is a dashboard?
A. An arrangement of individual
visualizations, along with other components, such as legends and filters
arranged on a single canvas
The visualization type used for understanding the
sequence of events with a duration is a:
A. Gantt chart
Which of the following merges the disparate
data sources?
A. Cross-database join
Which of the following
stores information about the connections and all the available
fields?
A. Data source
Which of the following features of Tableau helps in
revealing the patterns occurring over time for bringing life to data
storytelling?
A. Animated visualization
Which of the following trend models
follows an S-shaped curve?
A. Polynomial
What is a series of logical steps and changes that
can be applied to the data from input to output called?
A. Data flow
Which of the following components allows
the movement of objects on the dashboard?
A. Grip
_______ level formatting allows a user to make
global changes.
A. Workbook
Which of the following is a user-initiated event
that triggers a response?
A. Action
What defines a collection of records from
the data source?
A. Set
In a Tableau worksheet, if you set the Index
to Table (across then down), how will the Index values increment?
A. Horizontally across the entire
table, then steps down, continues to increment across, and repeats for the
entire table
Which of the following file extensions specifies a
Tableau Data Source extracted file?
A. .tdsx
Tableau treats any calculation with a numeric
result as a _____ by default.
A. measure
Which of the following keyboard shortcuts is used
to exit the Presentation Mode?
A. F7
The maximum number of entries allowed by
a format string in Tableau is:
A. three
Which of the following data source
connectors provides the user with the ability to remove and join any
data sources using programming languages?
A. Extract API
A placeholder for a single or global value such as
a number, date, or string is called a:
A. parameter
Which key should a user hold down while
dragging an object to convert it from tiled to floating or vice versa?
A. Shift
Which of the following types of formatting includes
font, alignment, shading, border, and lines?
A. Sheet
The multiple mark types are located beside each
other on which two shelves in Tableau?
A. Rows, Columns
What does an output step define?
A. The ultimate destination for the cleaned and
transformed data
Which of the following is a feature of a
bar chart?
A. It allows a user to compare the values across different categories.
Which of the following types of
bar chart is used for comparing a measure with a goal?
A. Bullet graph
Which of the
following techniques is used to dynamically show or hide the views on
a dashboard?
A. Sheet swapping
The _______ utility provides a user with
the ability to export data, images, or documents via the command
line.
A. tabcmd
Which of the following functions provides
a user with the ability to reference values in other rows?
A. Lookup()
What are quick table calculations?
A. Predefined calculations that can be applied to any
field used as a measure in the view
Which of the following techniques defines the
geographic areas or regions that users create as opposed to those
that are built in?
A. Custom territory
What does joining every record of the dataset
with every other record of another dataset create?
A. Cartesian product
How does the diverging palette in
Tableau represent data values?
A. It assigns a starting and ending number to create
two ranges of color intensity, blending from one color to another to display
the difference between positive and negative values.
_________ helps a user to quickly visualize
the confidence intervals, percentages, percentiles, quantiles, and
standard deviations of the dataset.
A. Distribution
Which model helps in predicting and
visualizing future values?
A. Forecasting
Tableau Server
Which of the following provides a user with the ability to programmatically export data in different formats?
REST API
What is Tableau Reader?
A free application provided by Tableau Software that
allows a user to interact with the visualizations, dashboards, and stories
created in Tableau Desktop
The _______ utility provides a user with the ability to export data, images, or documents via the command line.
Tabcmd
In Tableau, which of the following file extensions is used to save a packaged workbook?
.twbx
Which of the following keyboard shortcuts is used to exit the Presentation Mode?
F7
The Subscribe feature of the toolbar allows a user to:
schedule periodic emails of a screenshot of the dashboard
POST ASSISGNMENT
Which of the following code snippets will return the domain name from the provided email address?
SPLIT('abc@gmail.com','@',2)
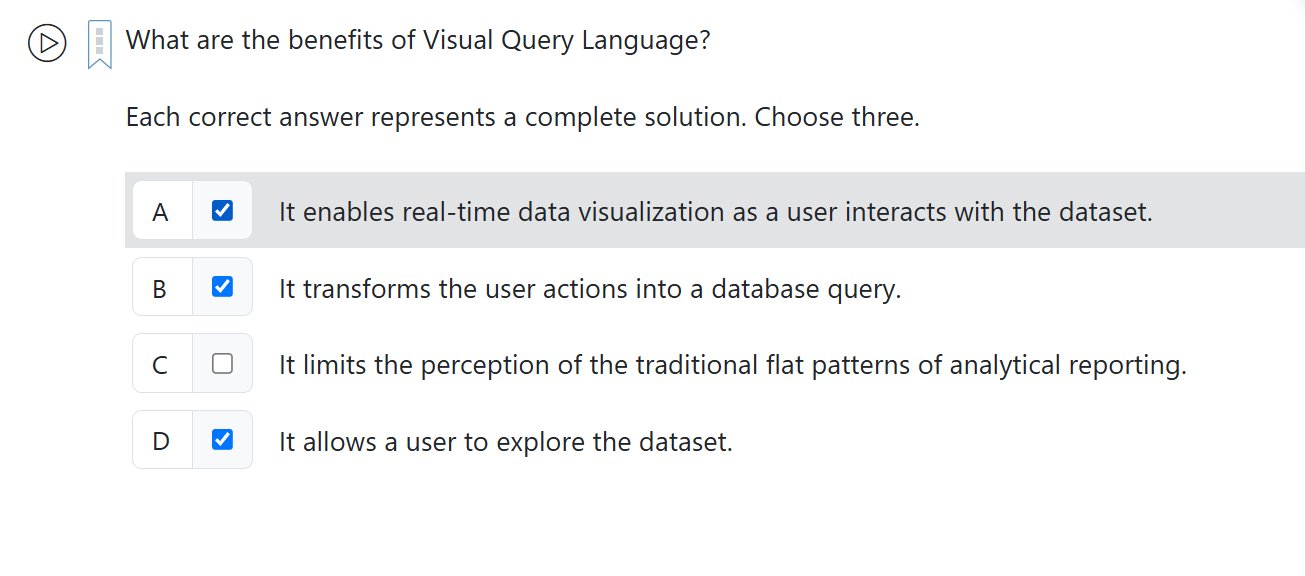
What are the benefits of Visual Query Language?
It transforms the user actions into a database query.
It allows a user to explore the dataset
It enables real-time data visualization as a user
interacts with the dataset.
Which of the following sections provide a user with the option to preview based on the target device?
Size, Sheets, and Objects
Ryan is provided with a data set that
contains the employment data of an industry for the year 2014-2019 for New York
City. He wants to analyze the job distribution and the changes in
various industries, and display the result in the form of a bar chart with
some stylistic visualization to represent the data value. Which of the
following types of charts should he use to represent the data in a stylistic
way?
Lollipop
chart
Emily is a data analyst working for a real estate company
that wants to visualize and compare trends in property prices across different
neighborhoods over the past decade. She needs to identify neighborhoods with
the highest appreciation rates in property prices and analyze how trends have
evolved over time. Which of the following charts will she use to accomplish the
task?
AREA
In Tableau, which of the following constraints are responsible for disabling the forecast model?
The view does not use a Table Calculation.
The view aggregation and the forecast aggregation are not
compatible.
The view uses a relational database.
What are the different methods of creating a parameter?
Use the drop-down menu next to Dimensions in the Data
pane and select Create Parameter.
Right-click on an empty area in the Data pane and select
Create Parameter
Charles, who works in the admission division of a college is working on a report in Tableau. He needs to provide the details of the students along with the academic scores throughout the semesters. The data source for student details provided to him contains some invalid data like the student name entered in the roll number column, improper email format used, and so forth. He needs to rapidly identify this invalid data to work with the report. Which of the following features will help him identify such data?
Data Roles
Which of the following points need to be taken into consideration while working with addressing and partitioning?
The At the Level option in the edit table calculation
dialog box allows a user to specify a level at which the table calculations are
performed.
The Restarting Every option allows a user to maintain the
fine-tuning of the ordering.
A user can specify the sort order.
A financial institution has decided to add a new subject, Tableau, to its curriculum. This subject will include topics such as the different visualization types, views, dashboards, and Tableau products that will be used in real-life scenarios. Which of the following Tableau products will be best suited for this purpose?
Tableau Public
Stella, a data analyst, is provided with the dataset of a college showing the details of the admissions that took place in the last five years. She has been asked to plot a graph representing the change in the number of admissions from the year 2015 to 2019 in an interactive way. Which of the following chart types should she use to show the change between the two data points?
Dumbbell
Which of the following actions are performed by a parameter?
Altering the results of a calculation
Changing the size of the bin
Passing values to a custom SQL statement
Dennis, a data analyst, has been asked to plot a graph displaying the per capita income of the states in a country using the range of a particular color, with the lighter tone indicating the lowest per capita income and the darker shade of the same color signifying the highest per capita income. Which of the following color palettes will help him accomplish the task?
Sequential
Jason has some data related to sales from different regions year-wise. He wants to calculate the percentage of sales from California over the total regions for which he has applied the formula:
Tableau calculation cannot mix aggregate and
non-aggregate arguments.
A survey was conducted by a private firm regarding the common activities performed by people going from home to work across the city. Jefferson had collected the survey data in a one-row-per-respondent format. Due to this, it has become challenging for him to analyze the survey data as for each question there is a separate column for its response. He wants to reshape the dataset into a format that will help in an easy analysis by reducing the number of columns. Which of the following data structures should he consider to reshape the dataset?
Tall
Jennifer works as a data analyst. She has prepared a working hours report for the previous month of all the employees working in the organization. There are some missing entries in the report as the working hours of some employees were not captured by the system. She needs to fill in those missing entries based on the nearby values. Which of the following Tableau features should she opt to accomplish the task?
Domain padding
What are the multiple ways to create an extract?
Select the Extract radio button on the Data Source
screen.
Right-click the data source on the Data pane and select
the Extract data option.
Developers can create an extract using the Tableau Data
Extract API.
John wants to narrate a story to the end-users using the different related views which, upon combining in a sequence, will form a complete story as a whole. Which of the following components of Tableau would help him complete the task?
Dashboard
Henry is provided with the furniture sales data for the last five months from different data sources. He has been asked to import these disparate data sources and combine them into one to carry out further calculations and analysis. Which of the following steps should he use to combine the different data sources based on the fields he selects?
Join
How can a trend line be added to the visualization in Tableau?
From the menu, select Analysis | Trend Lines | Show Trend
Lines.
Right-click the empty area in the pane of the view and
select Show Trend Lines.
Click the Analytics tab and drag and drop the Trend Line
on the desired trend model.
Aiden, a deputy finance manager, uses Tableau for managing the sales-related data for his organization. He has to conduct a seminar representing the sales trends of the company for the last ten years and also show a predictive analysis of the values in the coming future. Which of the following charts should he use to represent the desired trend?
Line
What are the prerequisites for creating a non-Cartesian chart type?
The mark type must be changed based on the desired chart
type.
Use any field as a measure on Size.
No continuous fields must be used on Rows or Columns.
Which of the following story components captures the filters and selections made by a user on a sheet without changing its structure?
Story point
Which of the following statements are true regarding a cluster group?
The individual members of a cluster group can be moved
among the groups.
It can be used in the calculated fields.
It can be aliased.
Which of the following considerations should be kept in mind while publishing a visualization to Tableau Public?
With Tableau Desktop and the proper permissions, a user
can save and open workbooks to and from Tableau Public using the Server menu
and selecting options under Tableau Public.
Workbooks saved to Tableau Public can contain any number
of data source connections, but they must all be extracted and must not contain
more than 15 million rows of extracted data each.
With the free Tableau Public client, a user can only save
workbooks to and from the web.
Liam is working on a data source that gives the rank of a sport based on the sum of skills needed for that sport like strength, power, speed, etc. Since the number of skills is more, it takes up too many columns of the dataset to work on. Liam wants to convert these column-wise data into row-wise as it will be easier for him to work and analyze. Which of the following primary steps of the Tableau Prep should he use to perform the task?
Pivot
Emily, a data analyst for an e-commerce company, is tasked with creating a ranked list of the top-selling products for each quarter. She needs to assign a rank to each product based on its sales within each quarter, without altering the original dataset or adding new fields to the data pane. This will help her management quickly identify the best-performing products over time. Which Tableau function should Emily use to dynamically assign a rank to each product based on sales within each quarter in a single view?
Index()
Ronald has some data related to flight bookings. He has prepared two sheets in Tableau, one containing a list of the countries showing the number of flights landing in that country, and another sheet showing a map displaying the average cost of the flight bookings country-wise. He wants to combine the sheet by using the map as a filter for the first sheet in an interactive way. Which of the following approaches of building a dashboard will help him display the combined sheet in a single view?
Exploratory
Liam, a data analyst, is working on a project for a retail chain. He needs to create a dashboard that displays the total sales for each store and ensures that the calculation of these sales is consistent, regardless of how he arranges the dimensions in his view. Which of the following table calculation types will help him perform the task?
Fixed
Mark works as a data analyst for a healthcare organization that wants to visualize patient satisfaction scores across different departments over the past years. He needs to identify patterns in satisfaction levels and determine which departments consistently have the highest or lowest scores. Which visualization type will he use to analyze and compare patient satisfaction scores across various departments over time?
Heat map
A customer service center uses Tableau to manage the data for its customers. They have used a hosted version of the software to get rid of the server configuration and maintenance and also provide an option to work remotely. As the software is a hosted version, it facilitates the option to connect to any data source anywhere. Which of the following Tableau products is being used by the organization?
Tableau Cloud
John works as a data analyst for an XYZ company. He has created a view in Tableau for the presentation. His manager has asked him to modify the visualization type of the objects and fields already present in the view. Which of the following Tableau components will help him accomplish the task?
Show Me
Which of the following modes allows a user to view the dashboards in fullscreen by hiding all the toolbars, panes, and authoring objects?
Presentation
Oliver is provided with an Excel sheet containing some unstructured data. The sheet contains the product details for a hundred items and thereafter, the same sheet contains some transactional data. He has been asked to separate both the data sets and import them into separate files using Tableau. Which of the following Tableau components should he use to accomplish the task?
Data Interpreter
In Tableau, which of the following applications are related to transparency?
Floating multiple worksheets on top of each other and
still be able to see each layer
Layering the visualizations on top of each other and over
background images
Overlaying transparent worksheets onto a dashboard
background image
David works as a data analyst. He wants to view the sales data for the last five financial years of the company to analyze the sales and profit trends. Which of the following file types should he use to save the extracted data in a binary file?
.tde
The Tableau feature that summarizes the information about all the available fields is ___________.
Metadata
Andrew works as a data analyst for an organization. One of his teammates is on emergency leave, and the client has requested information on a priority basis. He wants to locate the tasks, performance, and queries executed by his colleague so that he can provide accurate information requested by the client. Which of the following features of Tableau would help him accomplish the task?
Performance Recorder
Presley has prepared six sheets in Tableau that contain different types of data. He wants to display all of the six sheets on the dashboard and wants to ensure that each of the sheets occupies relatively the same amount of space and appears in a square grid layout. Which of the following Tableau features should he use to get the desired result?
Tiled layout
Harry, a data analyst, is working on a college placement module. He has been provided with the student, course, and company details stored in different tables. He has been asked to combine the data of all the tables and store the placement details in a single table. Which of the following data models should he use to combine all the details of different tables in a single table?
Star schema
Which of the following keys are responsible for ensuring a good data structure to work with?
Every record of a source data connection should be at a
meaningful level of detail.
Every measure contained in the source should match the
level of detail or possibly be at a higher level of detail.
Which of the following levels of formatting allows a user to change the fonts, alignment, shading, and number and date formats?
Field
William has been asked to prepare a consolidated report in Tableau containing data from his organization related to financial trends that are present in the form of flat files. Which of the following file types can he use to achieve his target?
Spatial files
Text files
Excel documents
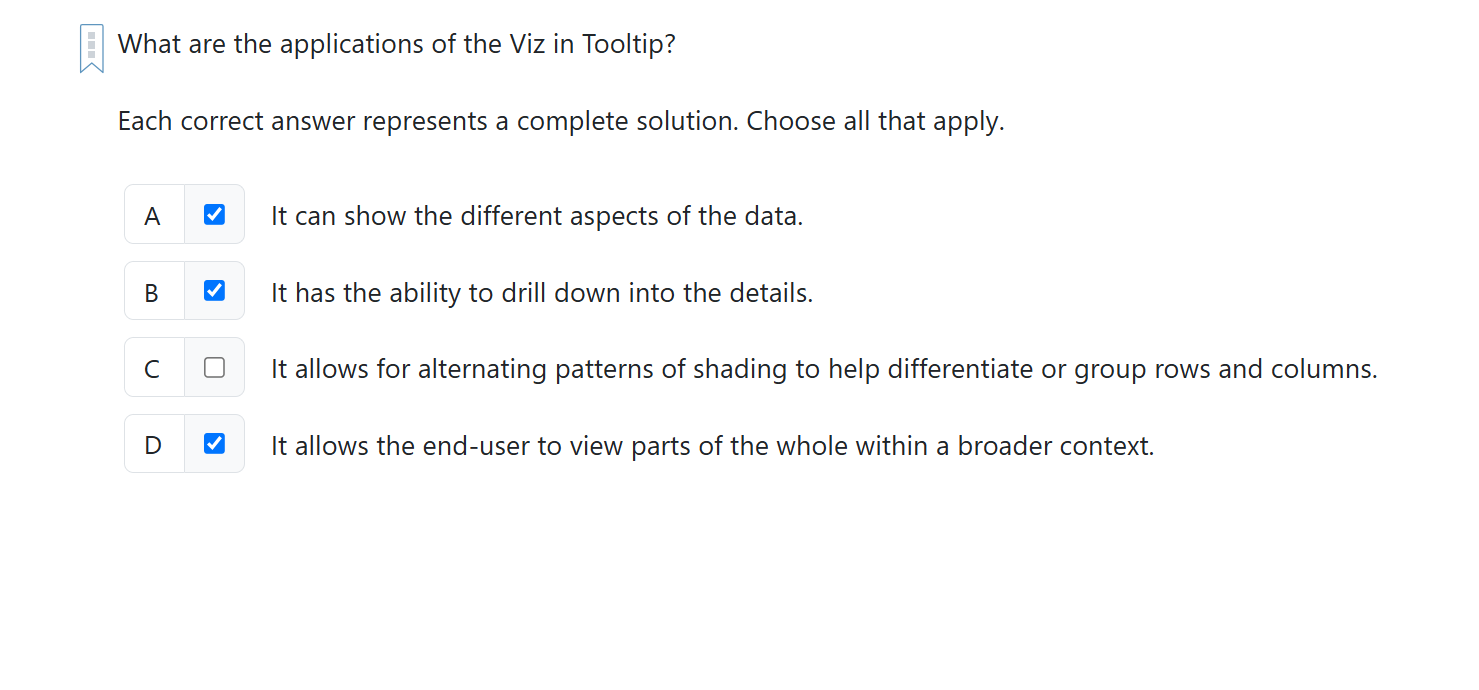
What are the applications of the Viz in Tooltip?
It has the ability to drill down into the details.
It can show the different aspects of the data.
It allows the end-user to view parts of the whole within
a broader context.
Alexandra works as a data analyst for a retail chain and is tasked with analyzing the distribution of customer purchase amounts at various store locations. She needs to identify store locations where customers tend to spend significantly higher or lower amounts compared to the overall average. Which of the following visualization types should she opt to accomplish the goal?
Box plot
Giselle is working as a data manager for a Sales Corporation. She has to create a detailed report of the sales activity, where she has to show the increase in sales per year for the past ten years. For this, she needs to perform a few calculations on the data such as running total, moving average, percent difference, etc. Which of the following calculations should she use to accomplish the task?
Quick table
Max works as a data administrator. He uses statistical tools, such as SAS and R, to generate files. Which of the following file extensions can be generated by Max using those statistical tools?
.rdata
.sas7bdat
.sav
Which of the following visualization types allows a user to understand part-to-whole relationships?
Stacked bar chart
Watson works in a stock market exchange and provides consultancy to new members who want to be a part of it. He aims to create a trend model for his clients to analyze the company's sales over the last five months. The data represents the law of diminishing returns. Which of the following trend models should he implement to accomplish the task?
Logarithmic
David has collected data related to the pandemic cases across the world from different data sources and combined them into one. After importing this combined data into Tableau, he found that there are some rows in the data set where the same country name is written in different forms like United States, USA, and US. He wants to make the data consistent so that he can perform calculations and analysis on them. Which of the following steps should he use to make the data consistent?
Clean
Which of the following approaches to building a dashboard indicates good versus poor performance?
A. Scorecard/Status snapshot
Which of the following statements is true regarding the mark annotation?
A.
It is linked to a specific mark and will not be visible if the mark is filtered out or falls outside the axis range.
What is a slope chart?
A. A type of chart that displays a change of value from one period to another
The ______ action focuses on specific marks and headers in one or more views.
A. highlight












































Comments
Post a Comment