Welcome to Module 4: Prototyping & Iteration!

In the previous modules, you’ve explored the foundations of data visualization, mastered data preparation, and learned how to select appropriate visual encodings. Now, it's time to bring your designs to life through prototyping and refinement.
This module will equip you with the essential skills to transform your abstract visualization ideas into tangible representations. You'll learn how to create quick and efficient low-fidelity prototypes, gather valuable feedback through usability testing, and refine your designs through an iterative process.
By the end of this module, you will be able to:
- Create effective low-fidelity prototypes for data visualizations.
- Conduct basic usability testing to gather user feedback.
- Apply the iterative design process to enhance your visualization designs.
Let's dive in and start building your visualization prototypes!
The Purpose of Prototyping

A prototype is a preliminary model, mockup, or sample version of a product or system built to test a concept or process. In essence, it's a tangible representation of an idea that allows designers, developers, and stakeholders to visualize, test, and refine their concepts before investing significant time and resources into full-scale development.
Why is Prototyping Important?
- Early Feedback: Prototypes allow for early testing and gathering user feedback, enabling designers to identify potential issues or areas for improvement.
- Risk Mitigation: By identifying and addressing problems early on, prototyping helps to reduce the risk of costly mistakes later in the development process.
- Communication: Prototypes serve as a visual communication tool, facilitating collaboration and understanding among team members and stakeholders.
- Iteration: Prototyping encourages a cyclical process of design, testing, and refinement, leading to continuous improvement.
Examples of Prototypes
- Low-Fidelity Prototypes: Simple sketches, wireframes, or storyboards that focus on the basic layout and structure of a design.
- Example: A hand-drawn sketch of a website's homepage.
- Medium-Fidelity Prototypes: More detailed representations that include visual elements and basic interactions.
- Example: A clickable prototype created using a design tool like Figma or Sketch.
- High-Fidelity Prototypes: Highly detailed prototypes that closely resemble the final product, often including interactive elements and realistic visuals.
- Example: A fully functional prototype of a mobile app.
In the context of data visualization, prototyping helps you:
- Experiment with different visual encodings and layouts.
- Test the effectiveness of your design in communicating information.
- Identify potential usability issues and make necessary adjustments
Prototyping Techniques for Data Visualizations
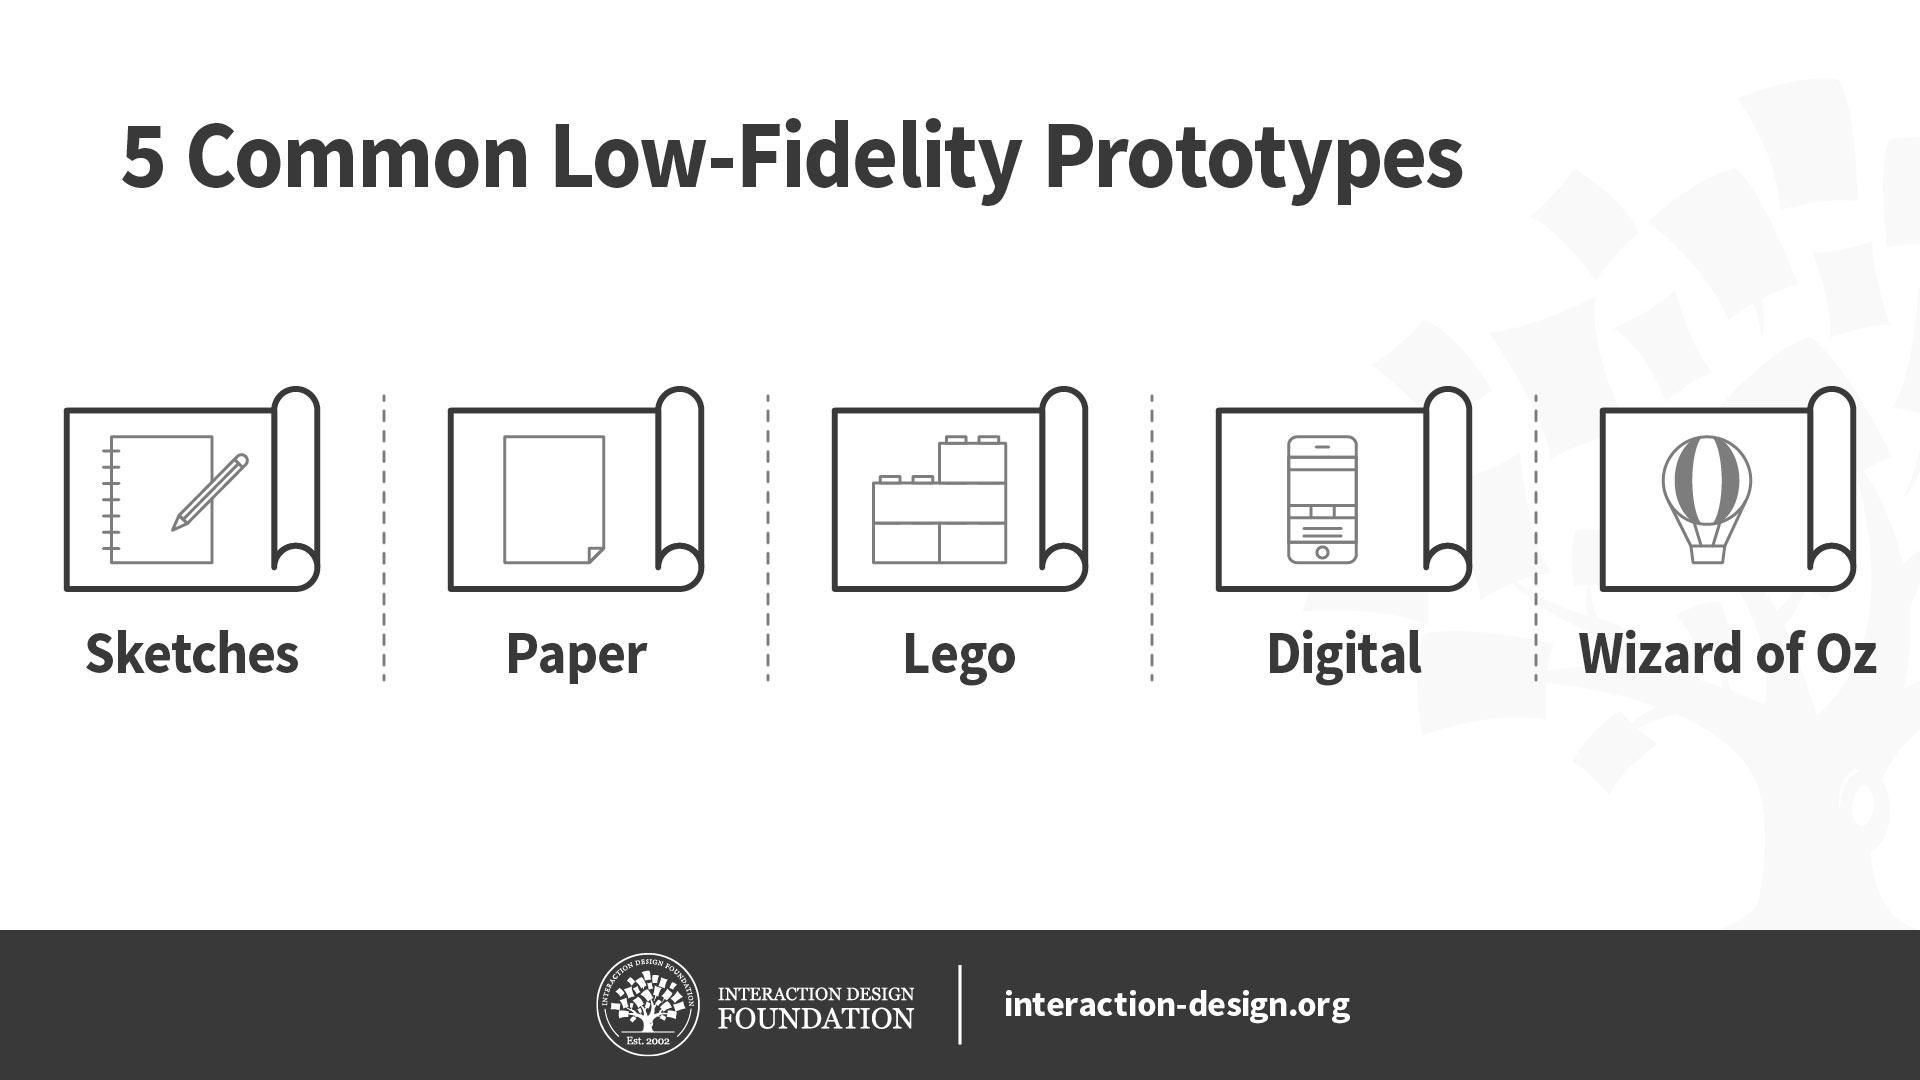
Prototyping is a crucial step in the data visualization process. It allows designers to experiment with different visual representations and gather feedback before investing significant time and resources in development. Here are some common prototyping techniques:
Low-Fidelity Prototyping
- Hand-drawn Sketches: Quick and simple sketches using pen and paper to capture the basic layout and structure of the visualization.
- Wireframes: Basic outlines of the visualization using simple shapes and lines to represent elements like charts, tables, and text.
- Storyboards: Sequential sketches or images that depict the flow of information in the visualization.
Medium-Fidelity Prototyping
- Digital Wireframes: Created using software tools to generate more detailed wireframes with interactive elements.
- Mockups: Static representations of the visualization that closely resemble the final design, including colors, images, and typography.
High-Fidelity Prototyping
- Interactive Prototypes: Functioning prototypes that allow users to interact with the visualization, providing a realistic experience of the final product.
- Animated Prototypes: Prototypes that incorporate motion and transitions to enhance the visual appeal and understanding of the data.
Additional Techniques
- Paper Prototyping: Creating interactive prototypes using paper and sticky notes to simulate user interactions.
- Wizard of Oz Prototyping: Simulating a system's functionality by manually performing tasks behind the scenes.
Choosing the right prototyping technique depends on the complexity of the visualization, the desired level of detail, and the available resources.
Prototyping is an optional step in the data visualization process.
Which prototyping technique is best suited for quickly visualizing the basic structure of a data visualization?
Low-fidelity prototype
Prototyping for a Financial Analysis Company: A Case Study
Understanding the Problem
Let's say a financial analysis company wants to visualize quarterly revenue trends for different product lines. The goal is to create a dashboard that allows users to quickly identify trends, anomalies, and opportunities.
Prototyping Process
- Define the Target Audience: Understanding who will use the visualization is crucial. In this case, it's likely financial analysts, managers, and executives.
- Identify the Key Metrics: Determine the most important data points to visualize. This might include total revenue, revenue by product line, revenue by region, and year-over-year growth.
- Choose a Prototyping Technique: For a financial dashboard, a medium-fidelity prototype using a design tool like Figma or Sketch would be suitable. This allows for interactive elements and a closer representation of the final product.
- Create a Basic Layout: Sketch out the general structure of the dashboard. Consider placing key metrics prominently, using clear and consistent labeling, and providing interactive elements like filters and drill-downs.
- Select Visualizations: Choose appropriate chart types for the data. For example, a line chart can show revenue trends over time, while a bar chart can compare revenue across product lines.
- Iterate and Refine: Based on initial feedback and testing, make adjustments to the layout, colors, and chart types. Ensure the visualization is easy to understand and provides actionable insights.
Example Prototype
A basic prototype might include:
- A large, central line chart showing total revenue over time.
- A bar chart comparing revenue for different product lines for the current quarter.
- A table displaying key financial metrics (e.g., revenue, profit, growth rate).
- Interactive elements like dropdown filters for selecting time periods and product lines.
Usability Testing
Once the prototype is created, it's essential to conduct usability testing with potential users. Observe how they interact with the dashboard, ask for feedback, and identify areas for improvement.
Iterative Design
Based on the feedback, refine the prototype. This might involve changing the layout, adding new visualizations, or improving the clarity of existing elements. The goal is to create a dashboard that effectively communicates the data and meets the needs of the target audience.
Remember, prototyping is an ongoing process. Continuous iteration based on user feedback is key to creating a successful data visualization.
Prototyping in Figma
Please watch this video for how to prototype using Figma:
https://youtu.be/Zez-8yrI6j8?si=eJjUSyIMf2JvKgaQ
Conducting Basic Usability Testing
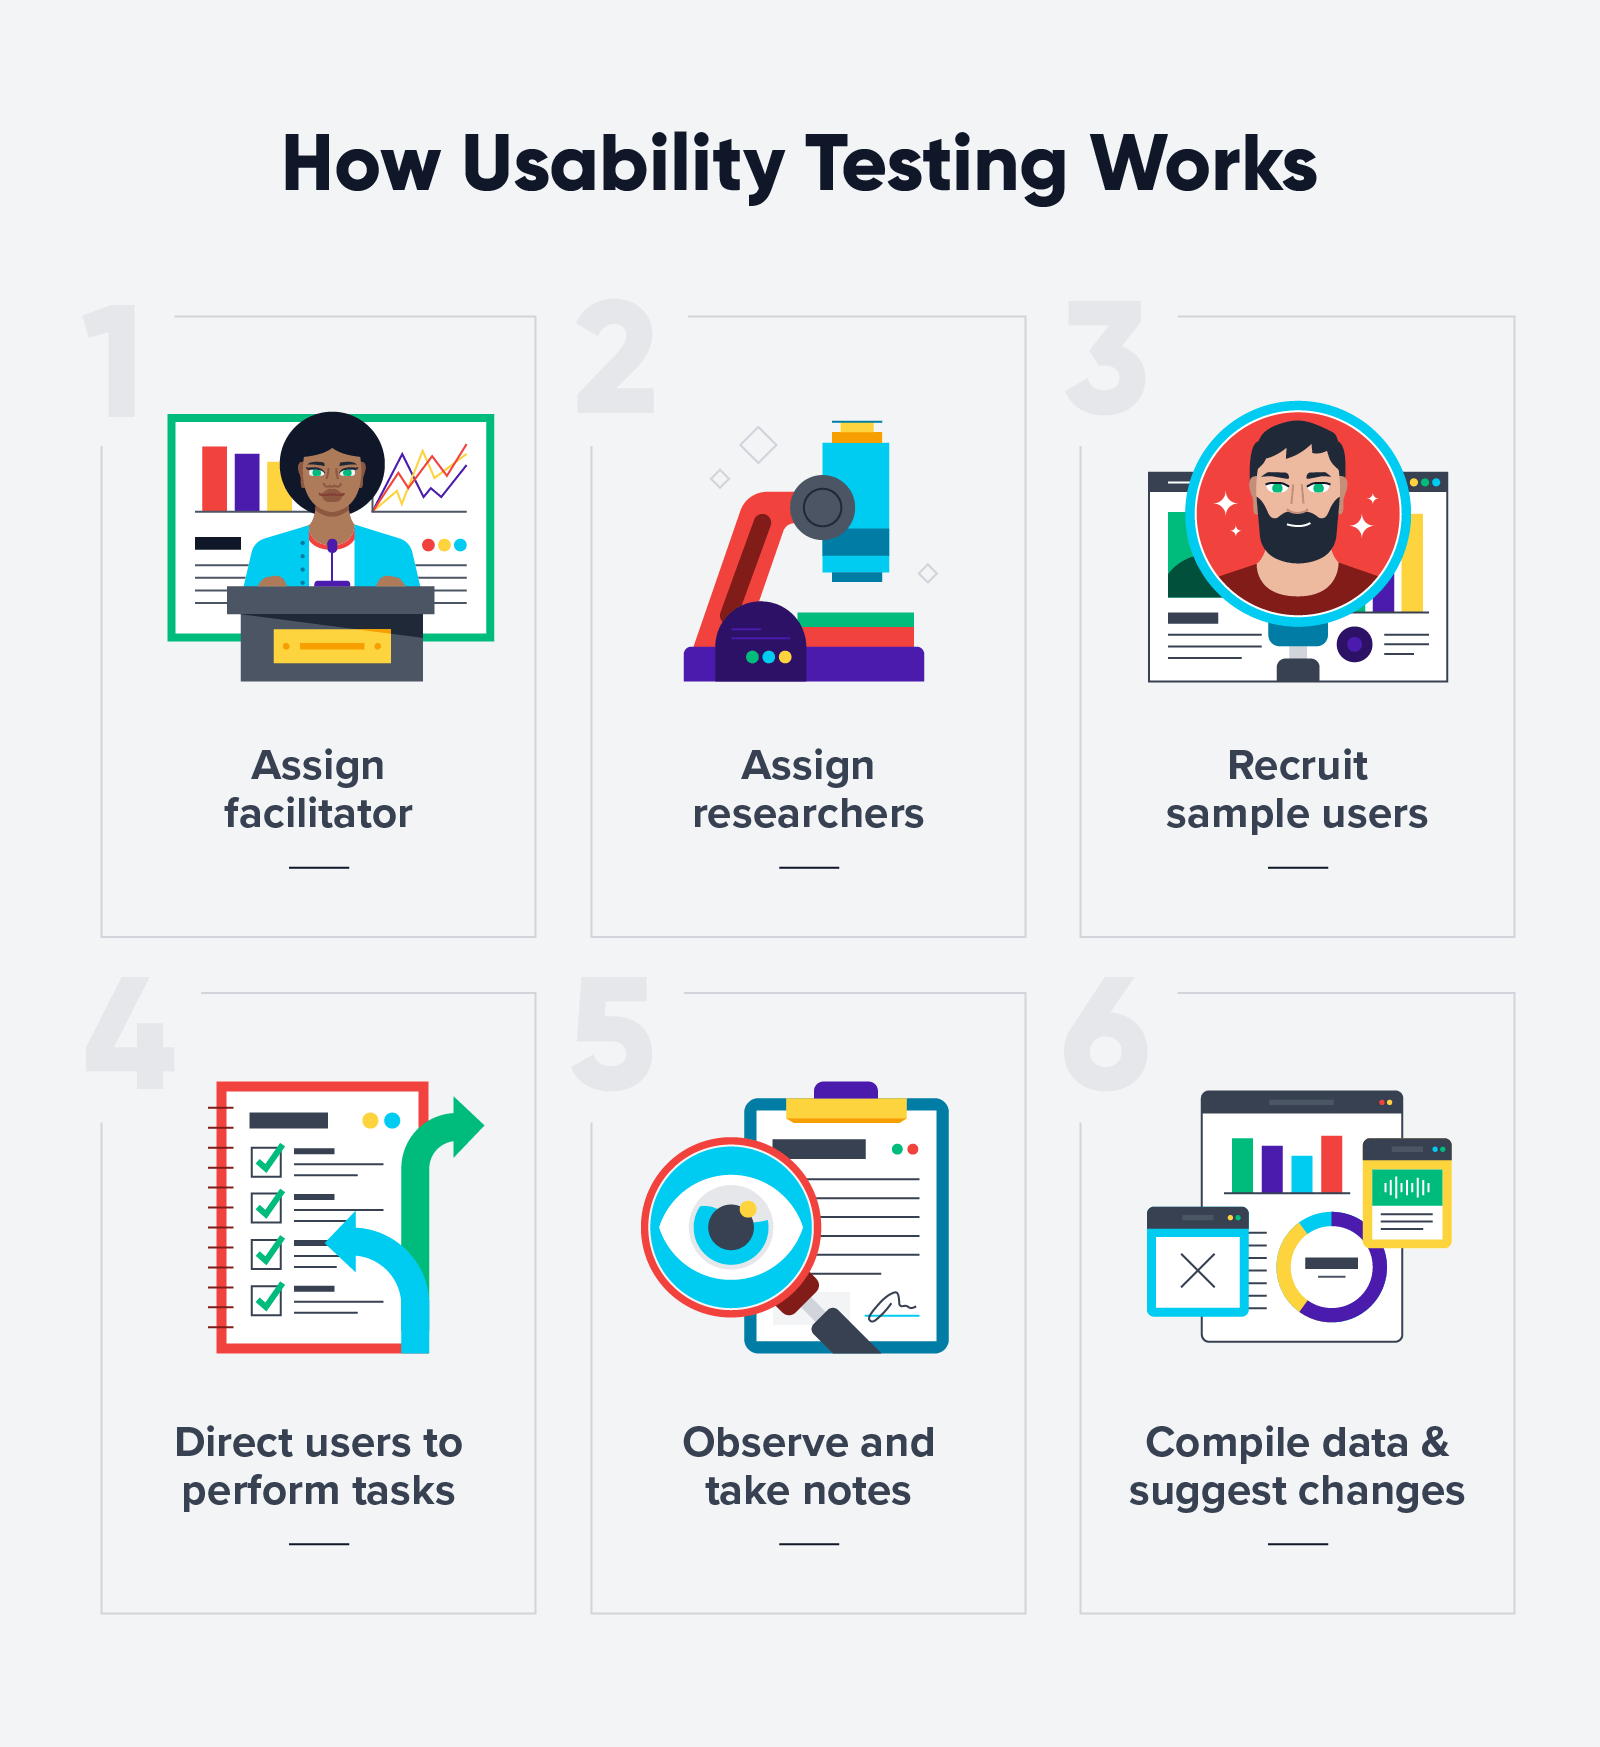
Usability testing is a crucial step in refining your data visualization. It involves observing users as they interact with your design to identify potential issues and areas for improvement. Here's a basic guide:
1. Define Your Goals
- Clearly outline what you want to learn from the test.
- Identify specific tasks you want users to perform.
- Determine the metrics you'll use to measure success (e.g., task completion time, error rates, user satisfaction).
2. Recruit Participants
- Identify your target audience and recruit participants who represent them.
- Aim for a sample size of 5-8 participants for a basic test.
3. Prepare Your Test
- Create a test script outlining the tasks participants will perform.
- Prepare any materials needed (e.g., prototype, task instructions).
- Set up a testing environment that minimizes distractions.
4. Conduct the Test
- Welcome participants and explain the purpose of the test.
- Observe participants as they complete tasks.
- Encourage participants to think aloud as they work.
- Avoid leading questions or offering help.
- Take notes on participant behavior and feedback.
5. Analyze Your Findings
- Review your notes and identify common issues or pain points.
- Calculate metrics to measure performance (e.g., task completion time, error rates).
- Prioritize issues based on their severity and impact on user experience.
6. Iterate Your Design
- Incorporate feedback into your design to address identified issues.
- Conduct additional rounds of testing if necessary.
Tips for Effective Usability Testing
- Create a comfortable and welcoming atmosphere.
- Build rapport with participants.
- Be open to unexpected findings.
- Use a mix of quantitative and qualitative data.
Remember: Usability testing is an iterative process. By gathering user feedback and making improvements, you can create data visualizations that are more effective and user-friendly.
Iterative Design Process and Visualization Refinement

Iterative design is a cyclical process that involves creating, testing, analyzing, and refining a product or design. In the context of data visualization, it's a crucial approach to ensure the final product effectively communicates information and meets user needs.
The Iterative Design Process
- Design: Create an initial visualization based on the data and desired insights.
- Prototype: Develop a representation of the visualization, whether a low, medium, or high-fidelity prototype.
- Test: Conduct usability testing to gather feedback on the visualization's effectiveness.
- Analyze: Review the test results and identify areas for improvement.
- Refine: Incorporate feedback into the design, creating a new iteration.
- Repeat: Continue the cycle of design, prototype, test, analyze, and refine until the visualization meets the desired standards.
Role in Visualization Refinement
The iterative design process plays a pivotal role in refining data visualizations by:
- Ensuring user-centricity: By involving users in the design process, you can create visualizations that meet their needs and expectations.
- Identifying and addressing issues: Through testing, you can uncover usability problems, visual clarity issues, or misleading information.
- Improving visual effectiveness: Iterations help refine the visual elements, such as color, typography, and chart types, to enhance understanding.
- Optimizing data communication: By testing different approaches, you can find the most effective way to convey the underlying data story.
- Adapting to changes: The iterative process allows for flexibility, enabling you to incorporate new data or insights as needed.
In essence, the iterative design process is a continuous learning and improvement loop that helps you create data visualizations that are both visually appealing and informative.
Iterative Design in Action: A Case Study
Let's imagine we're creating a visualization to show the relationship between education level and income over time.
Initial Design
We start with a simple scatter plot, with education level on the x-axis and income on the y-axis. We use different colors to represent different time periods.
Prototyping and Testing
We create a low-fidelity prototype of the scatter plot and conduct a usability test with a small group of people.
- Test Results: Participants find the scatter plot difficult to interpret, especially when comparing multiple time periods. They also struggle to identify trends.
Iteration 1
Based on the feedback, we introduce a line chart overlaying the scatter plot to show average income trends over time for each education level.
Testing and Refinement
We test the revised visualization and find it easier to understand, but the scatter plot points are still difficult to see.
Iteration 2
We adjust the opacity of the scatter plot points and add interactive elements, such as hovering over points to display detailed information.
Final Visualization
The final visualization includes a scatter plot with adjusted opacity, a line chart showing trends, and interactive elements. This provides a clear and informative view of the relationship between education level and income over time.
Key takeaways from this example:
- The iterative process involved multiple design, test, and refine cycles.
- User feedback was essential in identifying areas for improvement.
- The final visualization is more effective than the initial design due to the iterative process.
Interactive Scenario: Let's Create a Visualization!

Scenario: You work for a fitness app company and want to visualize the relationship between daily step count and hours of sleep for users.
Step 1: Initial Design
Proposed Visualization: A scatter plot with daily step count on the x-axis and hours of sleep on the y-axis. Each data point represents a user.
Our initial design: A scatter plot showing the relationship between daily step count and hours of sleep.
Step 2: Prototyping
To begin our prototyping process, let's create a simple sketch or digital wireframe of the scatter plot.
What elements would you like to include in our initial prototype? (select one path)

Im Select: User Data Points
Data Points Representing Individual Users
Each data point on the scatter plot will represent one user. The position of the data point on the graph will be determined by the user's daily step count (x-axis) and hours of sleep (y-axis).
Key considerations:
- Data point size: The size of the data points should be appropriate for the scale of the graph and the number of data points.
- Data point shape: Consider using a consistent shape for all data points, such as circles or squares.
- Data point color: Consider using a neutral color for the data points, or using color to represent additional information (e.g., age, gender).
How to Add:
- Data Input: Ensure your data is in a suitable format (e.g., CSV, Excel) with columns for user ID, daily step count, and hours of sleep.
- Data Mapping: Map the data to visual elements. Each data point will be represented as a circle or other shape on the plot.
- Plotting: Use a visualization library or software to plot the data points based on their corresponding x (step count) and y (hours of sleep) values.
Code Example: Adding Data Points
| Daily Step Count | |
|---|---|
| 10000 | 7 |
| 12000 | 8 |
| 8000 | 6 |
| 15000 | 9 |
| 9000 | 7.5 |

Interactive Lesson Summary
Topic: Data Visualization Prototyping and Design
- Prototyping Techniques: We discussed various prototyping techniques, including low, medium, and high-fidelity prototypes.
- Usability Testing: We explored the importance of usability testing and outlined basic steps for conducting it.
- Iterative Design: We explained the iterative design process and its role in refining visualizations.
- Case Study: We created a hypothetical scenario to demonstrate the iterative design process for a scatter plot visualizing the relationship between daily step count and hours of sleep.
- Coding Example: We provided a basic Python code example to create a scatter plot using Matplotlib.
Iterative design involves creating a visualization, testing it, and then making improvements based on the results.
The primary purpose of usability testing in data visualization is to:
Free Tools and Ideas for Creating Low-Fidelity Prototypes
Assignment Tips~
Free Tools
- Pen and paper: The most basic and accessible tool. It allows for quick sketching and iteration.
- Digital Whiteboards: Platforms like Miro, Mural, or even Google Jamboard offer digital spaces for collaboration and sketching.
- Simple Drawing Tools: Basic drawing tools like Paint or Sketchpad can be used for digital sketches.
- Wireframing Tools: Some tools like Balsamiq offer free or limited versions for basic wireframing.
Ideas for Low-Fidelity Prototypes
- Sketching: Quickly draw the basic layout and elements of your visualization.
- Storyboarding: Create a sequence of sketches to show how users will interact with the visualization.
- Wireframing: Use basic shapes and lines to represent the structure of the visualization.
- Role-playing: Act out how users might interact with the visualization to identify potential issues.
Remember, the goal of low-fidelity prototyping is to quickly explore ideas and gather feedback. Focus on the core functionality and information hierarchy rather than the visual design.
Additional Resources for Further Learning
Online Platforms and Tutorials
- DataCamp: Offers interactive data science and visualization courses.
- Coursera, edX, Udemy: Provide a variety of data visualization courses from universities and industry experts.
- YouTube: Channels like Data School, StatQuest, and Khan Academy offer informative tutorials.
- Kaggle: A platform for data science competitions and datasets, with many visualization examples.
Books and Publications
- "The Visual Display of Quantitative Information" by Edward Tufte
- "Storytelling with Data" by Cole Knaflic
- "Designing Data Visualizations" by Rob Kitchin
- "Information is Beautiful" by David McCandless
- "The Wall Street Journal Guide to Information Graphics" by The Wall Street Journal
Tools and Software
- Tableau, Power BI, Looker: Business intelligence and data visualization tools.
- Python libraries: Matplotlib, Seaborn, Plotly, Bokeh for creating visualizations.
- R packages: ggplot2, plotly, shiny for interactive visualizations.
- D3.js: JavaScript library for creating complex and interactive visualizations.
Online Communities and Forums
- Reddit (r/dataisbeautiful, r/visualization)
- Data Visualization Society
- Online forums and communities related to specific visualization tools
End of Lesson Summary
Congratulations on completing Module 4: Prototyping and Iteration!
In this module, you've gained a solid foundation in the essential steps of transforming data into compelling visualizations. You've learned the significance of:
- Prototyping: Creating preliminary versions of your visualization to test and refine your design.
- Usability Testing: Gathering feedback from users to identify areas for improvement.
- Iterative Design: Continuously refining your visualization based on user insights.
By mastering these skills, you're well-equipped to create data visualizations that not only look impressive but also effectively communicate information to your audience.
Remember: Data visualization is an evolving field. Continuously explore new techniques, tools, and best practices to stay ahead.
We encourage you to experiment with different visualization types, conduct thorough usability testing, and seek inspiration from various sources.
Ready to take your data visualization skills to the next level? Explore advanced topics like interactive visualizations, data storytelling, and data ethics.

Comments
Post a Comment